Copyright
©The Author(s) 2005.
World J Gastroenterol. Oct 7, 2005; 11(37): 5821-5827
Published online Oct 7, 2005. doi: 10.3748/wjg.v11.i37.5821
Published online Oct 7, 2005. doi: 10.3748/wjg.v11.i37.5821
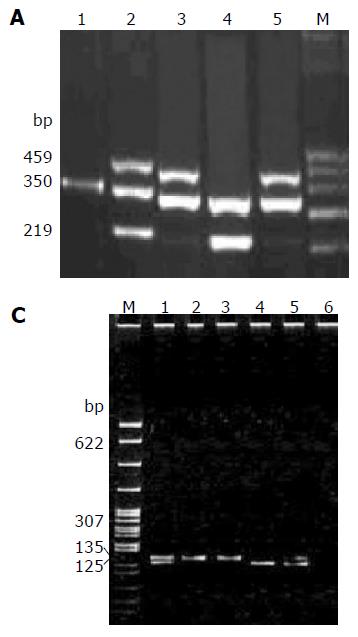
Figure 1 PCR products A: PCR products of GSTT1 and GSTM1.
M: DNA marker; lanes 1-5 DNA products; lane 1: none; lane 2: GSTT1 and GSTM1; lane 4: GSTM1; lanes 3, 5: GSTT1. B: PCR-RLFP products of CYP2E1. M: DNA marker; lanes 1-5 DNA products. Homozygous c1c1 shows a single band with 410 bp; homozygous c2c2 shows two bands with 290 bp and 120 bp; and heterozygous c1c2 shows all three bands. C: PCR products of ALDH2. Lanes 1-6 DNA products; M: DNA marker. Homozygous 2-2 shows a single band with 135 bp; homozygous 1-1 shows two bands with 125 bp and 10 bp; and heterozygous 1-2 shows all the three bands. D: PCR products of ADH2. Lanes 1-6: DNA products; M: DNA marker. Homozygous 1-1 shows a single band with 95 bp; homozygous 2-2 shows two bands with 60 bp and 35 bp; and heterozygous 1-2 shows all the three bands.
- Citation: Zhu SM, Ren XF, Wan JX, Xia ZL. Evaluation in vinyl chloride monomer (VCM)-exposed workers and the relationship between liver lesions and gene polymorphisms of metabolic enzymes. World J Gastroenterol 2005; 11(37): 5821-5827
- URL: https://www.wjgnet.com/1007-9327/full/v11/i37/5821.htm
- DOI: https://dx.doi.org/10.3748/wjg.v11.i37.5821


