Copyright
©The Author(s) 2005.
World J Gastroenterol. Sep 28, 2005; 11(36): 5718-5720
Published online Sep 28, 2005. doi: 10.3748/wjg.v11.i36.5718
Published online Sep 28, 2005. doi: 10.3748/wjg.v11.i36.5718
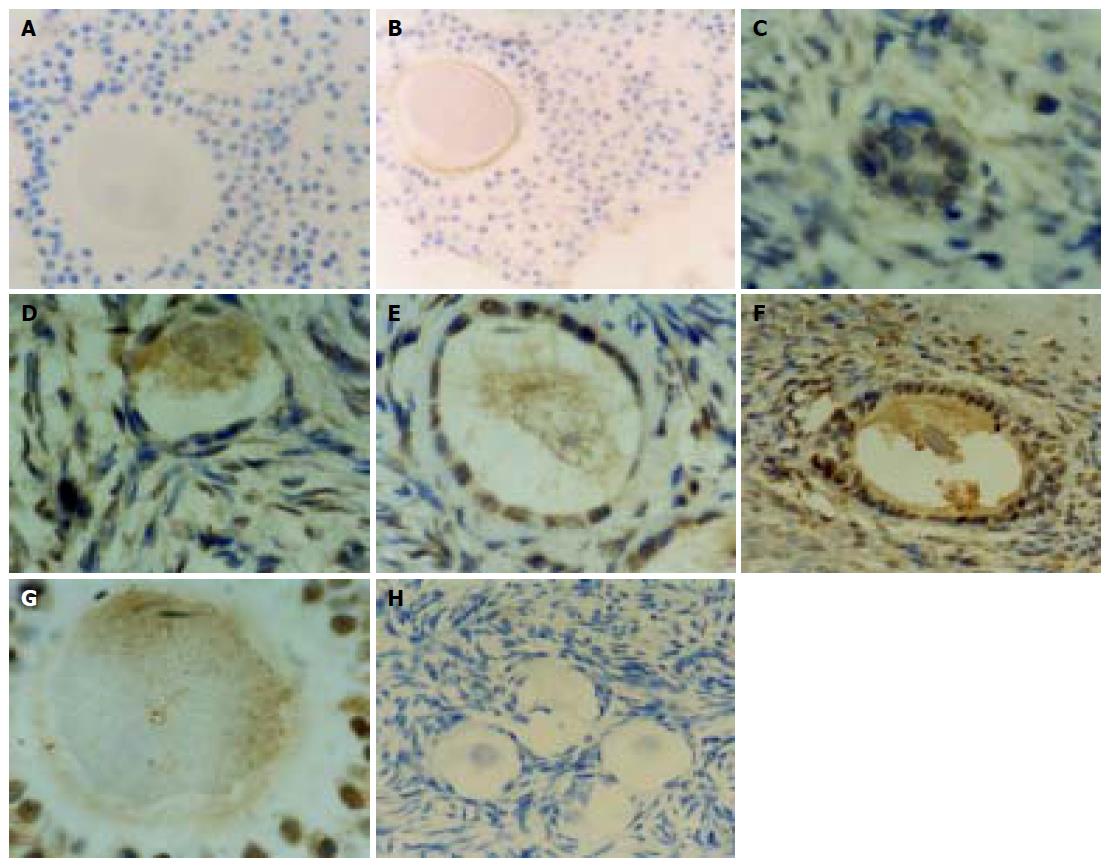
Figure 1 Expression of HBsAg and HBcAg in the ovaries and ova.
A: HBsAg negative control (original magnification:10×40); B: expression of HBsAg in plasma and membrane of ova and granular cells (original magnification:10×40); C: expression of HBcAg in plasma, membrane and nuclei of sinus ova, granular and interstitial cells (original magnification: 10×100); D and E: expression of HBcAg in plasma, membrane and nuclei of primary ova, granular and interstitial cells (original magnification: 10×40); F: expression of HBcAg in plasma, membrane and nuclei of secondary ova, granular and interstitial cells (original magnification: 10×40); G: expression of HBcAg in plasma, membrane and nuclei of mature ova, granular and interstitial cells (original magnification: 10×100); H: HBcAg negative control (original magnification: 10×40).
- Citation: Ye F, Yue YF, Li SH, Chen TY, Zhang SL, Bai GQ, Liu M. Expression of HBsAg and HBcAg in the ovaries and ova of patients with chronic hepatitis B. World J Gastroenterol 2005; 11(36): 5718-5720
- URL: https://www.wjgnet.com/1007-9327/full/v11/i36/5718.htm
- DOI: https://dx.doi.org/10.3748/wjg.v11.i36.5718


