Copyright
©2005 Baishideng Publishing Group Inc.
World J Gastroenterol. Sep 21, 2005; 11(35): 5565-5567
Published online Sep 21, 2005. doi: 10.3748/wjg.v11.i35.5565
Published online Sep 21, 2005. doi: 10.3748/wjg.v11.i35.5565
Figure 1 Positive HBsAg (A) expression and positive HBcAg (B) expression in ovarian tissue and negative control (C and D).
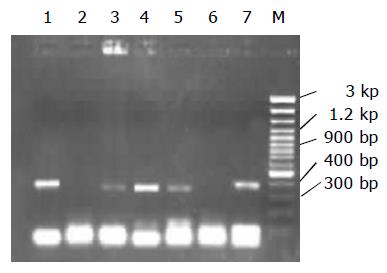
Figure 2 Detection of HBV DNA in ovarian tissue by PCR.
M: DNA marker; lanes 1, 3, 4 and 5: positive samples; lane 6: negative control; lane 7: positive control.
- Citation: Chen LZ, Fan XG, Gao JM. Detection of HBsAg, HBcAg, and HBV DNA in ovarian tissues from patients with HBV infection. World J Gastroenterol 2005; 11(35): 5565-5567
- URL: https://www.wjgnet.com/1007-9327/full/v11/i35/5565.htm
- DOI: https://dx.doi.org/10.3748/wjg.v11.i35.5565


