Copyright
©The Author(s) 2005.
World J Gastroenterol. Sep 14, 2005; 11(34): 5342-5346
Published online Sep 14, 2005. doi: 10.3748/wjg.v11.i34.5342
Published online Sep 14, 2005. doi: 10.3748/wjg.v11.i34.5342
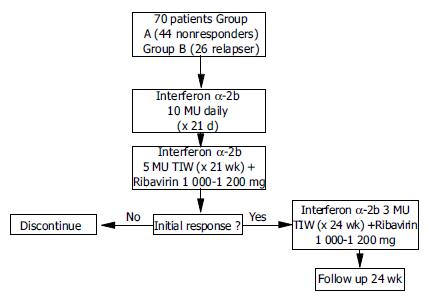
Figure 1 Trial profile of group A (non-responder) and group B (relapser).
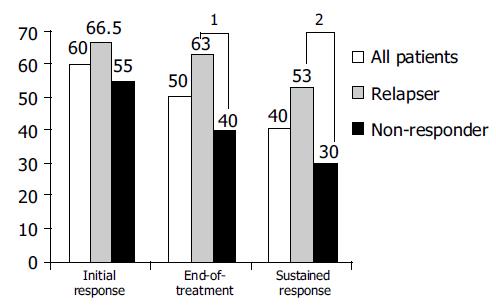
Figure 2 Response rates in relation to former response after IFN-α monotherapy.
1P = 0.05; 2P = 0.049; χ2 test.
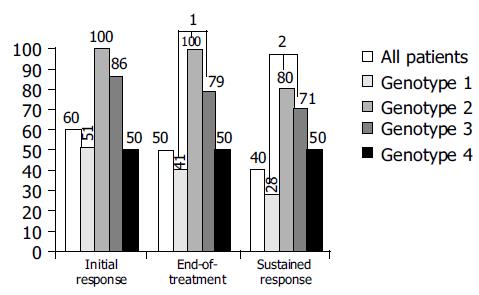
Figure 3 Response rates in relation to genotype (genotype 1 vs 2/3).
1P = 0.005; 2P = 0.001; χ2 test.
- Citation: Hass HG, Kreysel C, Fischinger J, Menzel J, Kaiser S. High-dose interferon-α2b induction therapy in combination with ribavirin for treatment of chronic hepatitis C in patients with non-response or relapse after interferon-α monotherapy. World J Gastroenterol 2005; 11(34): 5342-5346
- URL: https://www.wjgnet.com/1007-9327/full/v11/i34/5342.htm
- DOI: https://dx.doi.org/10.3748/wjg.v11.i34.5342


