Copyright
©The Author(s) 2005.
World J Gastroenterol. Sep 14, 2005; 11(34): 5309-5313
Published online Sep 14, 2005. doi: 10.3748/wjg.v11.i34.5309
Published online Sep 14, 2005. doi: 10.3748/wjg.v11.i34.5309
Figure 1 Basal levels of pro- (A) and anti-inflammatory cytokines (B) in patients and healthy controls.
aP < 0.05 vs others.
Figure 2 Cellular pre -activation status: comparison of basal levels of cytokines with those measured in the supernatant of non-stimulated cultures, in patients with severe (A) or mild AP (B), and healthy controls (C).
aP < 0.05 vs others.
Figure 3 Cellular functional reserve: comparison of levels of cytokines measured in the stimulated cultures in patients with severe (A) or mild AP (B), and healthy controls (C).
supernatant of stimulated whole blood cultures with values obtained in non-aP < 0.05 vs others.
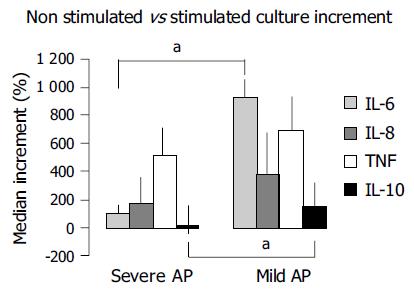
Figure 4 Cellular functional reserve represented as increments of all studied cytokines in patients.
aP < 0.05 vs others.
- Citation: Laveda R, Martínez J, Muñoz C, Penalva JC, Sáez J, Belda G, Navarro S, Feu F, Mas A, Palazón JM, Sánchez-Payá J, Such J, Pérez-Mateo M. Different profile of cytokine synthesis according to the severity of acute pancreatitis. World J Gastroenterol 2005; 11(34): 5309-5313
- URL: https://www.wjgnet.com/1007-9327/full/v11/i34/5309.htm
- DOI: https://dx.doi.org/10.3748/wjg.v11.i34.5309


