Copyright
©The Author(s) 2005.
World J Gastroenterol. Sep 7, 2005; 11(33): 5109-5116
Published online Sep 7, 2005. doi: 10.3748/wjg.v11.i33.5109
Published online Sep 7, 2005. doi: 10.3748/wjg.v11.i33.5109
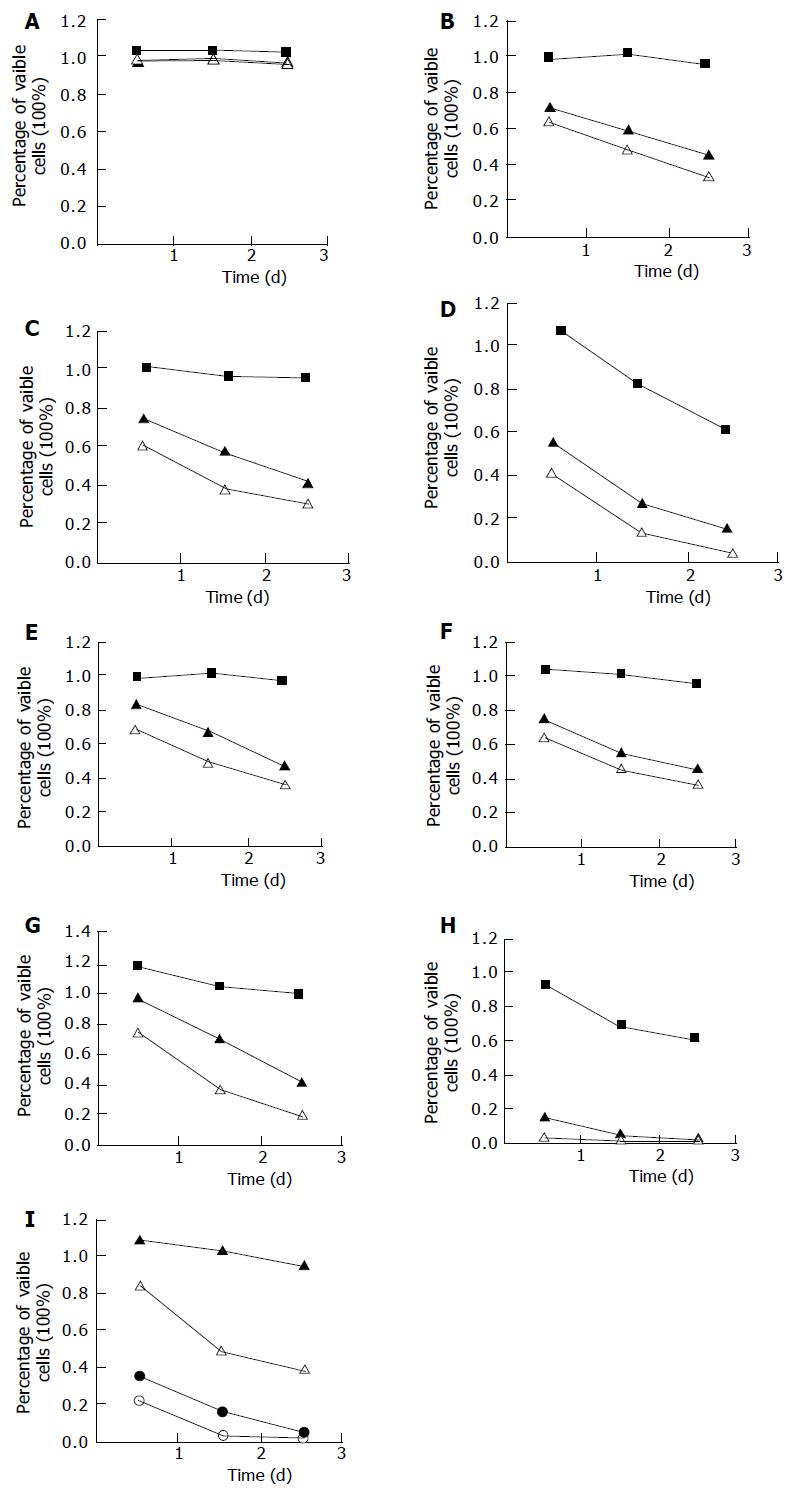
Figure 1 Effect of bile salts on Eca109 cell growth.
■ (at 50 mmol/L), ▲ (at 250 mmol/L), △ ( at 500 mmol/L), ● (1 000 mmol/L), ○ (1 500 mmol/L). A: Glycocholate; B: Glycochenodeoxycholate; C: Glycodeoxycholate; D: Taurocholate; E: Taurochenodeoxychoate; F: Taurodeoxycholate; G: Cholic acid; H: Deoxycholic acid; I: Mixed bile salts.
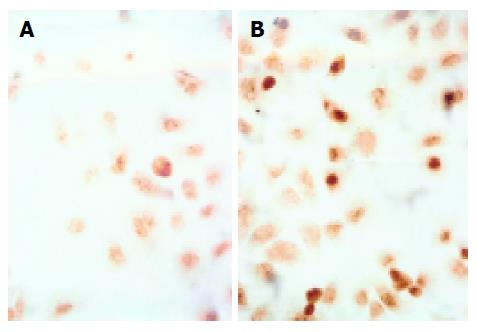
Figure 2 TC-induced apoptosis of control (A) and cells treated with TC (B) ×400.
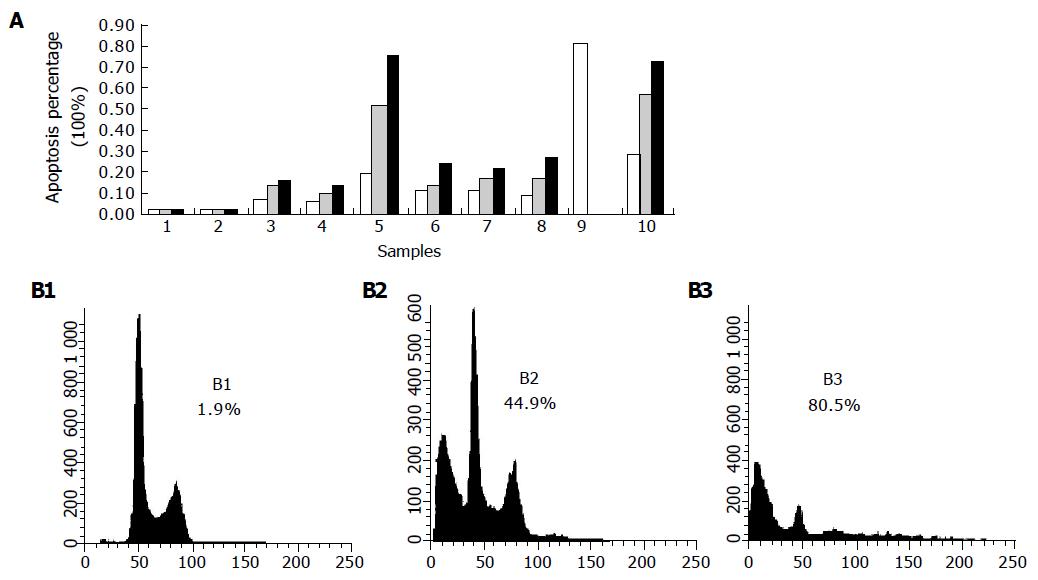
Figure 3 Time-dependent apoptosis of Eca109 cells induced by bile salts or bile acids (A) and DCA (B1-3).
1: Control; 2: GC; 3: GCDC; 4: GDC; 5: TC; 6: TCDC; 7: TDC; 8: CA; 9: DCA; 10: mixed bile salts. ■ (after 24 h), (after 48 h), □ (after 72 h).
Figure 4 Apoptosis of control (A) and cells treated with GCDC (B) and DCA (C).
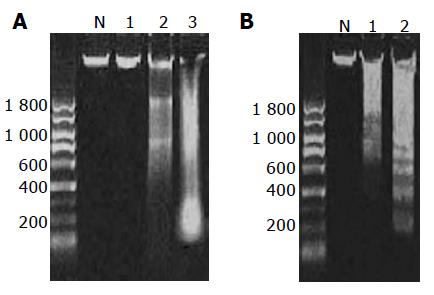
Figure 5 DNA ladder formation in cells treated with TC (A, Lane 2) and DCA (A, Lane 3) and mixed bile salts (B, Lane 1 and 2).
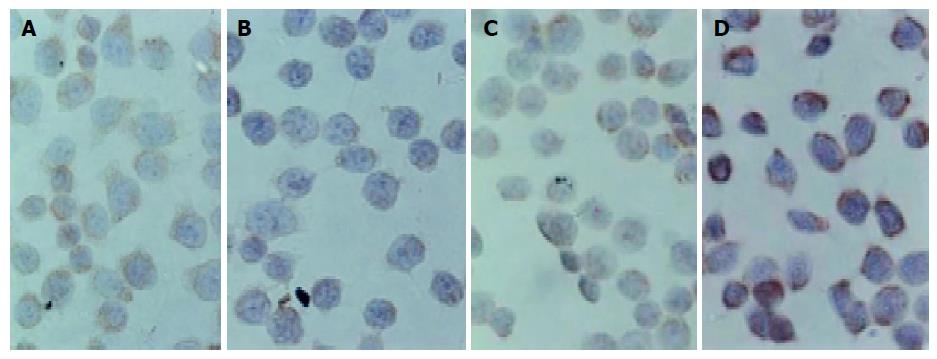
Figure 6 Active caspase-3 in the control (A) and cells treated with GC (B) and TC (C).
Figure 7 Expression of Bcl-2 (B) and Bax proteins (D) and controls (A: Bcl-2 and C: Bax) ×400.
- Citation: Zhang R, Gong J, Wang H, Wang L. Bile salts inhibit growth and induce apoptosis of human esophageal cancer cell line. World J Gastroenterol 2005; 11(33): 5109-5116
- URL: https://www.wjgnet.com/1007-9327/full/v11/i33/5109.htm
- DOI: https://dx.doi.org/10.3748/wjg.v11.i33.5109


