Copyright
©The Author(s) 2005.
World J Gastroenterol. Aug 21, 2005; 11(31): 4807-4811
Published online Aug 21, 2005. doi: 10.3748/wjg.v11.i31.4807
Published online Aug 21, 2005. doi: 10.3748/wjg.v11.i31.4807
Figure 1 Masson staining of liver sections in perindopril treated-group (6 wk, panel A) and model group (6 wk, panel B).
Perindopril [2 mg/(kg•d)] was administered for 6 wk. Less proliferation of fibrotic septa and marked fatty degeneration in the portal tract are evident in panel A (final magnification 100×).While in panel B, the lobule is disorderly, and wide portal to portal fibrotic septa is evident. Extensive fatty degeneration is present around portal tracts and the central veins (final magnification 100×).
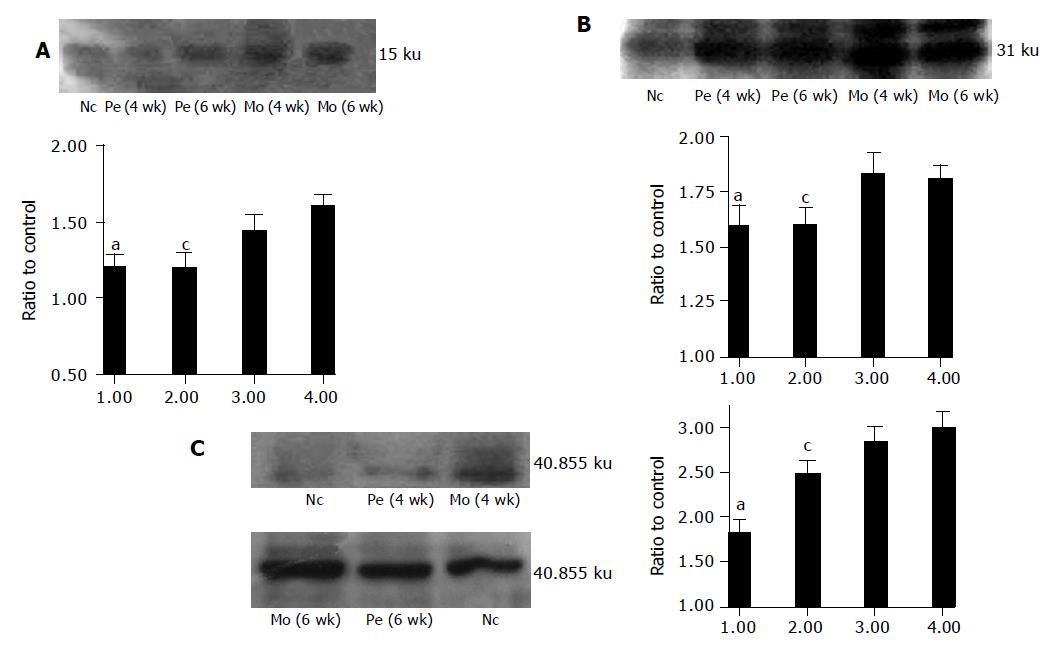
Figure 2 Western blot analysis A: Western blot analysis of TGF-b1 protein expression.
Effect of perindopril on TGF-b1 expression in CCl4-induced hepatic fibrosis of rat. Cell lysates were obtained as described in Methods. Protein (50 mg/lane) were separated by 15% SDS-PAGE under denaturing conditions, transferred to PVDF membranes and then incubated with specific antibody (1:700). Ratio to control presents TGF-b1 protein level. 1: Pe (4 wk); 2: Pe (6 wk); 3: Mo (4 wk); 4: Mo (6 wk) Results are the mean±SD from three independent experiments. aP<0.05 vs Mo (4 wk); cP<0.05 vs Mo (6 wk); B: Western blot analysis of PDGF-BB protein expression. Effect of perindopril on PDGF-BB expression in CCl4-induced hepatic fibrosis of rat. Cell lysates were obtained as described in Methods. Protein (50 mg/lane) were separated by 10% SDS-PAGE under denaturing conditions, transferred to PVDF membranes and then incubated with specific antibody (1:700). Ratio to control presents PDGF-BB protein level. 1: Pe (4 wk); 2: Pe (6 wk); 3: Mo (4 wk);4: Mo (6 wk) Results are the mean±SD from three independent experiments. aP<0.05 vs Mo (4 wk); cP<0.05 vs Mo (6 wk); C: Western blot analysis of AT1R protein expression. Effect of perindopril on AT1R expression in CCl4-induced hepatic fibrosis of rat. Cell lysates were obtained as described in Methods. Protein (50 mg/lane) were separated by 10% SDS-PAGE under denaturing conditions, transferred to PVDF membranes and then incubated with specific antibody (1:700). Ratio to control presents AT1R protein level. 1: Pe (4 wk); 2: Pe (6 wk); 3: Mo (4 wk); 4: Mo (6 wk) Results are the mean±SD from three independent experiments. aP<0.05 vs Mo (4 wk); cP<0.05 vs Mo (6 wk).
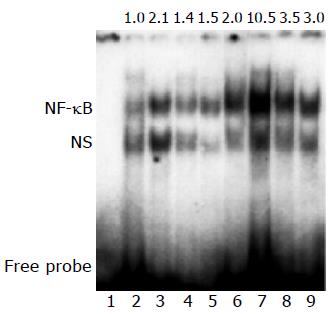
Figure 3 EMSA for NF-kB DNA binding activity.
EMSA for NF-kB DNA binding activity. Lane 1: 100 folded excess unlabeled oligonucleotides; lane 2: control group; lanes 3 and 4: Pe (4 wk); lanes 5 and 6: Pe (6 wk); lanes 7 and 8: Mo (4 wk); lane 9: Mo (6 wk). NF-kB DNA binding activity markedly increased in model group, perindopril treatment considerably reduced NF-kB activity. Binding specificity was demonstrated by competition of excess unlabeled oligonucleotides containing the kB site. Results are representative of three independent experiments.
Figure 4 Zymography analysis of activities of MMP-2 and MMP-9.
Effect of perindopril on the activities of MMP-2 (72 ku) and MMP-9 (94 ku) in CCl4-induced hepatic fibrosis of rat. Liver samples were obtained as described. Protein (50 mg/lane) were separated by 7.5% gelatin containing SDS-PAGE, then remove SDS and incubate in zymogram incubation buffer as described. The clear band presents the activity of MMP-2,9. The activity of MMP-2,9 was elevated in Mo (4, 6 wk) compared with Nc and Pe (4, 6 wk).
- Citation: Li X, Meng Y, Yang XS, Mi LF, Cai SX. ACEI attenuates the progression of CCl4-induced rat hepatic fibrogenesis by inhibiting TGF-β1, PDGF-BB, NF-κB and MMP-2,9. World J Gastroenterol 2005; 11(31): 4807-4811
- URL: https://www.wjgnet.com/1007-9327/full/v11/i31/4807.htm
- DOI: https://dx.doi.org/10.3748/wjg.v11.i31.4807


