Copyright
©The Author(s) 2005.
World J Gastroenterol. Aug 21, 2005; 11(31): 4788-4793
Published online Aug 21, 2005. doi: 10.3748/wjg.v11.i31.4788
Published online Aug 21, 2005. doi: 10.3748/wjg.v11.i31.4788
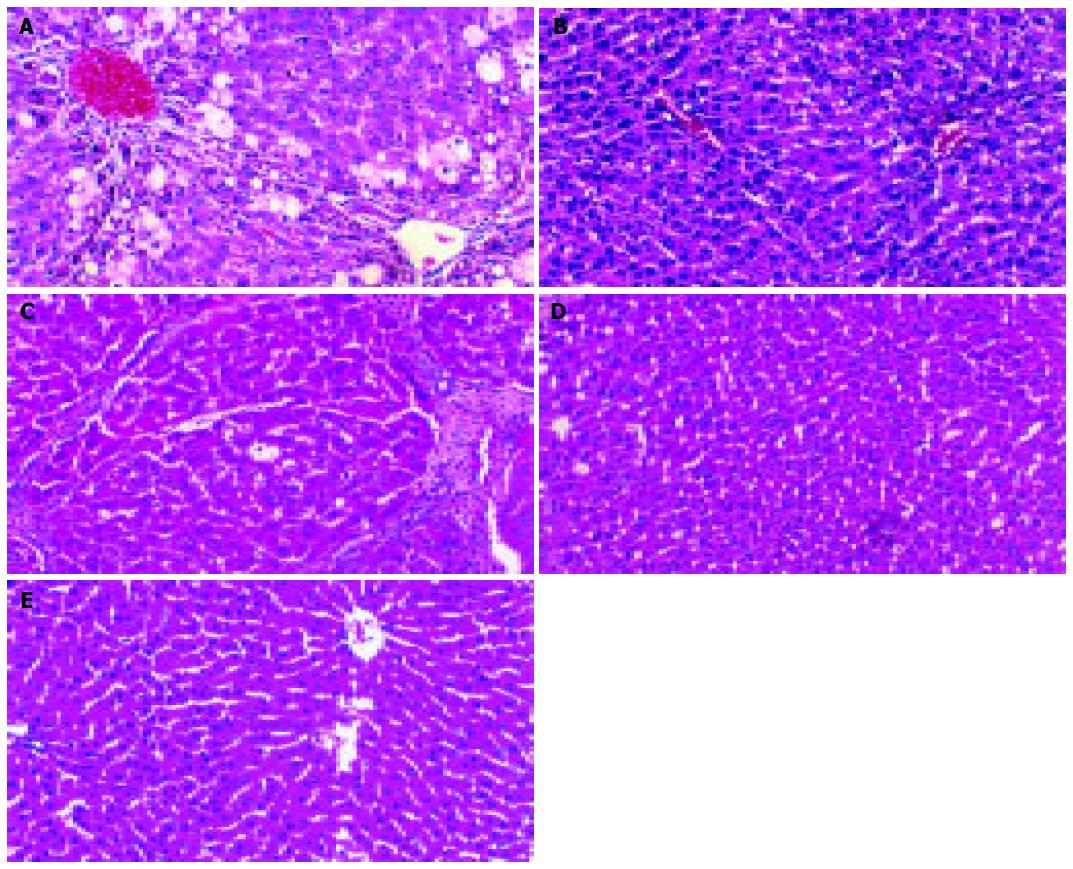
Figure 1 Effect of IL-10 on liver histology of hepatic fibrosis rats.
A: Rat liver in group C at the 7th wk (HE×100); B: Rat liver in group I at the 7th wk (HE×100); C: Rat liver in group C at the 11th wk (HE×100); D: Rat liver in group I at the 11th wk (HE×100); E: Rat liver in group N (HE×100).
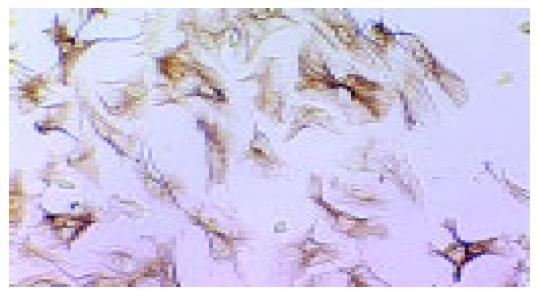
Figure 2 Desmin expression of HSCs from primary culture for 5 d by immunochemistry (SP×100).
Figure 3 RT-PCR analysis of growth factor gene expression of HSC before and after intervention.
A: Electrophoretogram of PCR for TGF-β1 gene of HSCs. 1-3: groups N, C, I of 11th wk; 4-6: groups N, C, I of 7th wk; M: DNA ladder of 100 bp; B: Electrophoretogram of PCR for EGF gene of HSCs. 1-3: groups N, C, I of 11th wk; 4-6: groups N, C, I of 7th wk; M: DNA ladder of 100 bp; C: Electrophoretogram of PCR for HGF gene of HSCs. 1-3 groups N, C, I of 11th wk; 4-6: groups N, C, I of 7th wk; M: DNA ladder of 100 bp.
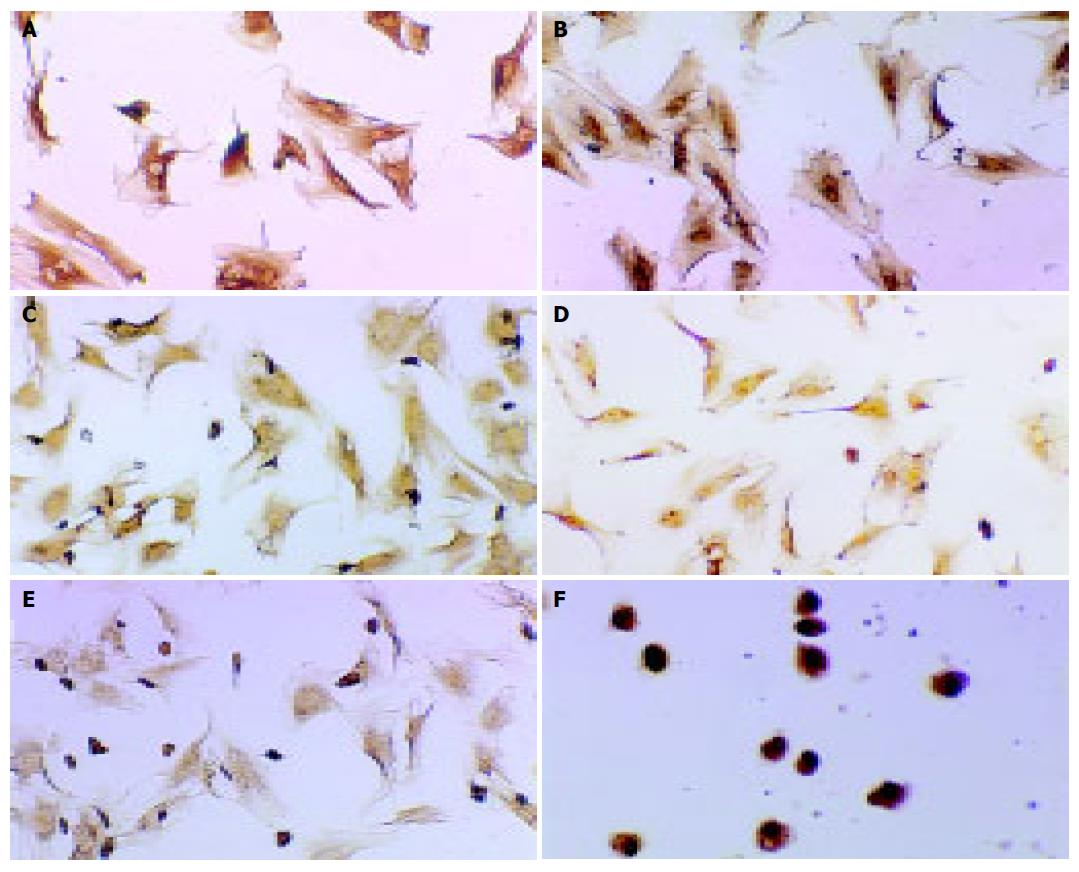
Figure 4 Expression of growth factor protein of HSCs in different groups.
A: Expression of PDGF protein of HSCs in group C at the 7th wk (SP×100); B: Expression of PDGF protein of HSCs in group I at the 7th wk (SP×100); C: Expression of TGF-β1 protein of HSCs in group C at the 7th wk (SP×100); D: Expression of TGF-β1 protein of HSCs in group I at the 7th wk (SP×100); E: Expression of EGF protein of HSCs in group C at the 11th wk (SP×100); F: Expression of EGF protein of HSCs in group I at the 11th wk (SP×100).
- Citation: Shi MN, Zheng WD, Zhang LJ, Chen ZX, Wang XZ. Effect of IL-10 on the expression of HSC growth factors in hepatic fibrosis rat. World J Gastroenterol 2005; 11(31): 4788-4793
- URL: https://www.wjgnet.com/1007-9327/full/v11/i31/4788.htm
- DOI: https://dx.doi.org/10.3748/wjg.v11.i31.4788


