Copyright
©The Author(s) 2005.
World J Gastroenterol. Aug 14, 2005; 11(30): 4745-4749
Published online Aug 14, 2005. doi: 10.3748/wjg.v11.i30.4745
Published online Aug 14, 2005. doi: 10.3748/wjg.v11.i30.4745
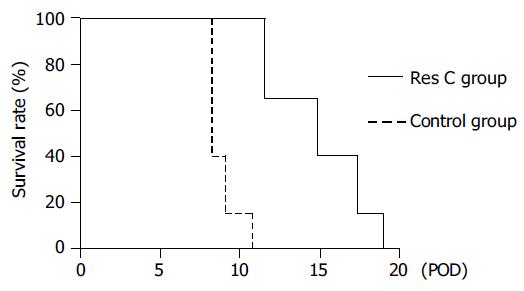
Figure 1 Survival rate of rats after liver transplantation.
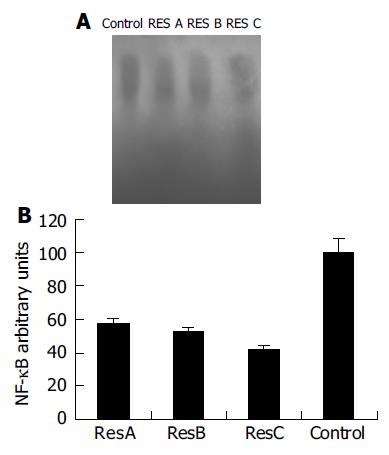
Figure 2 Levels of NF-κB in peripheral T lymphocytes analyzed by EMSA (A) AND quantitation of NF-κB activity by PhosphorImager(B).
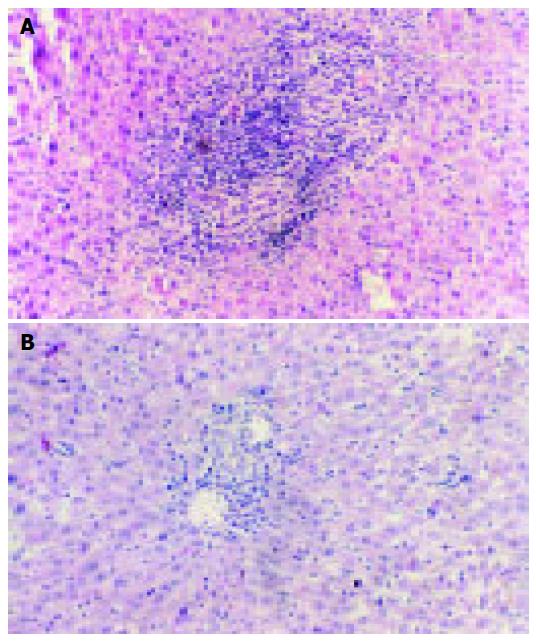
Figure 3 Typical signs of severe graft rejection in control group (A) and RES C group (B).
- Citation: Wu SL, Yu L, Meng KW, Ma ZH, Pan CE. Resveratrol prolongs allograft survival after liver transplantation in rats. World J Gastroenterol 2005; 11(30): 4745-4749
- URL: https://www.wjgnet.com/1007-9327/full/v11/i30/4745.htm
- DOI: https://dx.doi.org/10.3748/wjg.v11.i30.4745


