Copyright
©The Author(s) 2005.
World J Gastroenterol. Aug 7, 2005; 11(29): 4596-4599
Published online Aug 7, 2005. doi: 10.3748/wjg.v11.i29.4596
Published online Aug 7, 2005. doi: 10.3748/wjg.v11.i29.4596
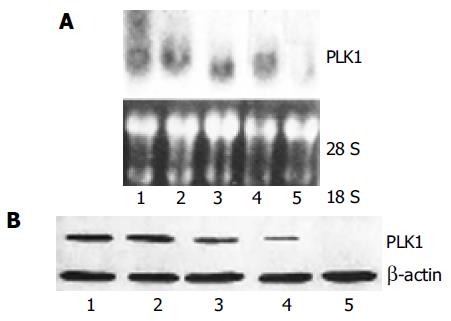
Figure 1 Inhibition of PLK1 mRNA and protein expression by ASODN demonstrated in Northern blot (A) and Western blot (B) analyses.
Lane 1: control group; lane 2-5: groups treated by ASODN (50 nmol/L) after 12, 24, 48 and 72 h.
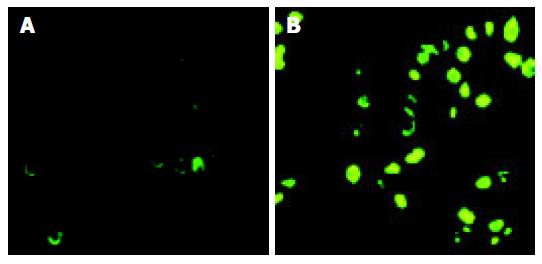
Figure 2 AI induced by ASODN in control group (A) and PLK1 group (B).
Figure 3 Effect of ASODN on cell cycle distribution of cancer cells.
A: Control; B: Treatment cells; C: Cells in G2/M.
- Citation: Fan Y, Zheng S, Xu ZF, Ding JY. Apoptosis induction with polo-like kinase-1 antisense phosph-orothioate oligodeoxynucleotide of colon cancer cell line SW480. World J Gastroenterol 2005; 11(29): 4596-4599
- URL: https://www.wjgnet.com/1007-9327/full/v11/i29/4596.htm
- DOI: https://dx.doi.org/10.3748/wjg.v11.i29.4596


