Copyright
©The Author(s) 2005.
World J Gastroenterol. Jul 28, 2005; 11(28): 4396-4399
Published online Jul 28, 2005. doi: 10.3748/wjg.v11.i28.4396
Published online Jul 28, 2005. doi: 10.3748/wjg.v11.i28.4396
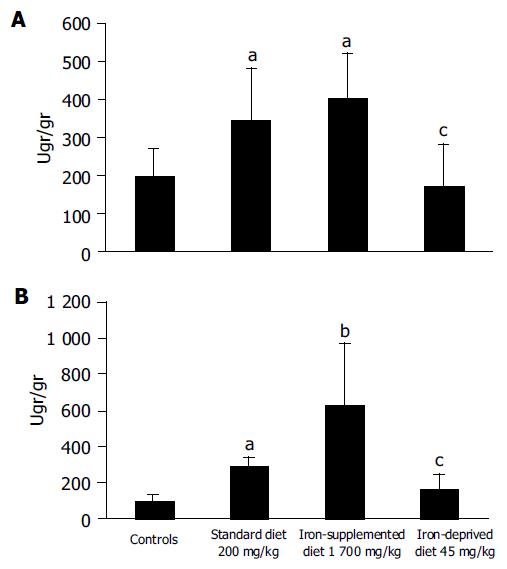
Figure 1 (PDF) Liver ( A) and colonic ( B) iron concentrations.
aP<0.05, bP<0.01 vs controls; cP<0.05 vs standard diet.
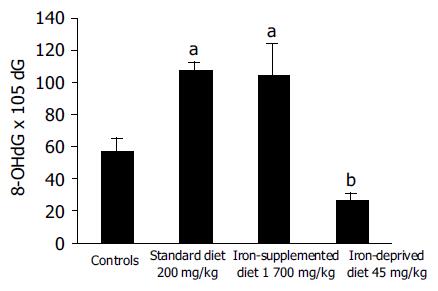
Figure 2 (PDF) Colonic DNA adducts.
aP<0.05 vs controls; bP<0.01 vs standard diet.
- Citation: Barollo M, D'Inc R, Scarpa M, Medici V, Cardin R, Bortolami M, Ruffolo C, Angriman I, Sturniolo G. Effects of iron manipulation on trace elements level in a model of colitis in rats. World J Gastroenterol 2005; 11(28): 4396-4399
- URL: https://www.wjgnet.com/1007-9327/full/v11/i28/4396.htm
- DOI: https://dx.doi.org/10.3748/wjg.v11.i28.4396


