Copyright
©The Author(s) 2005.
World J Gastroenterol. Jul 14, 2005; 11(26): 4045-4051
Published online Jul 14, 2005. doi: 10.3748/wjg.v11.i26.4045
Published online Jul 14, 2005. doi: 10.3748/wjg.v11.i26.4045
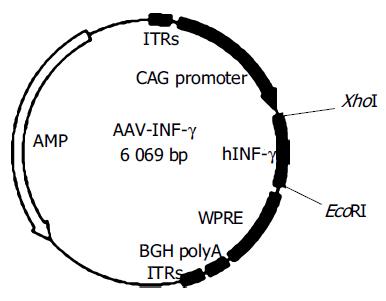
Figure 1 Structure of recombinant plasmid AAV-INF-γ.
Human INF-γ cDNA obtained from RT-PCR was cloned into AAV plasmid, which contains a CAG promoter, WPRE enhancer and BGH polyA.
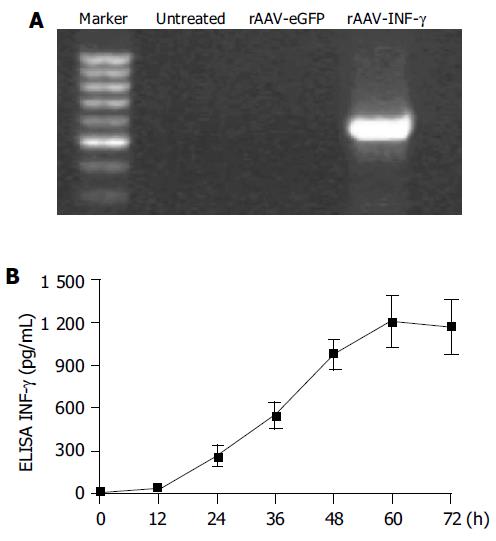
Figure 2 The expression of INF-γ in rAAV-INF-γ infected HSCs.
A: RT-PCR analysis of INF-γ expression in rAAV-INF-γ infected HSCs. The untreated and rAAV-eGFP infected HSCs did not show any PCR band; B: Time course of the INF-γ expression in the HSC supernatants after rAAV-INF-γ infection. (Data are mean±SD, n = 6).
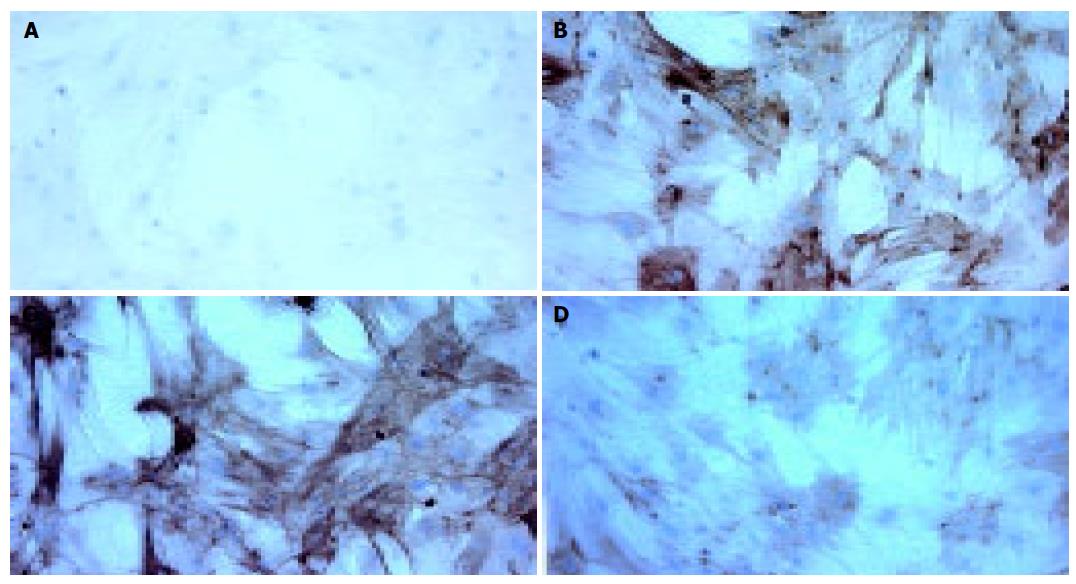
Figure 3 The expression of α-SMA in different group of primary cultured HSCs.
Expressions of α-SMA were determined by immunocytochemical method. A: Immunocytochemistry of untreated HSCs without primary antibody as the negative control; B: Immunocytochemistry of untreated HSCs; C: Immunocytochemistry of rAAV-eGFP infected HSCs; D: Immunocytochemistry of rAAV-INF-γ infected HSCs.
Figure 4 The mRNA expression of fibrosis related cytokines and proteases in different group of primary cultured HSCs.
A: mRNA expression of TGF-β, MMP-13 and TIMP-1 in HSCs were examined by RT-PCR method; B: Densitometric units were calculated by dividing the density of individual bands by that of GAPDH. Closed column, untreated. Lined column, rAAV-eGFP induced. Dotted column, rAAV-INF-γ induced. (Data are mean±SD, n = 8, aP < 0.05).
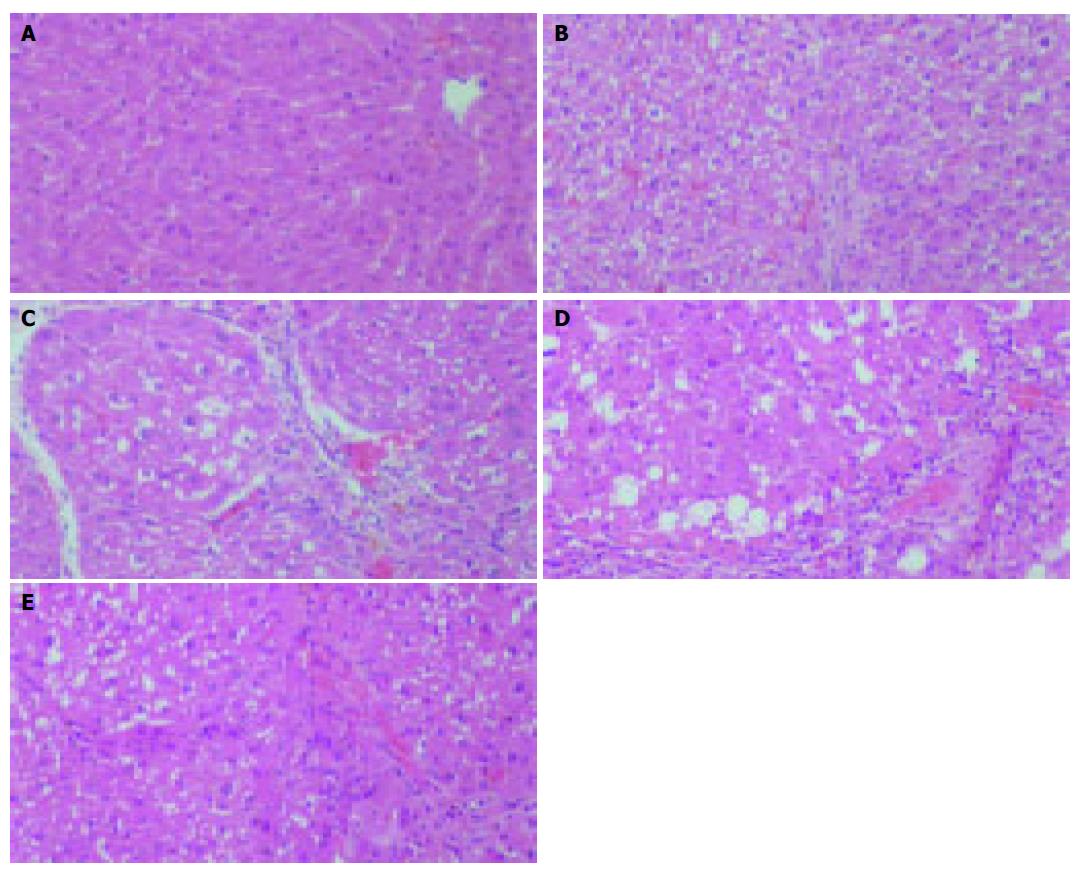
Figure 5 Improvement of CCl4 induced experimental hepatic fibrosis by rAAV-INF-γ treatment in histology analysis.
Rat liver section in each group stained with Hematoxylin Eosin: A: No treatment; B: CCl4 (3 wk); C: CCl4/saline; D: CCl4/rAAV-eGFP; E: CCl4/rAAV-INF-γ. (Magnification 200 ×).
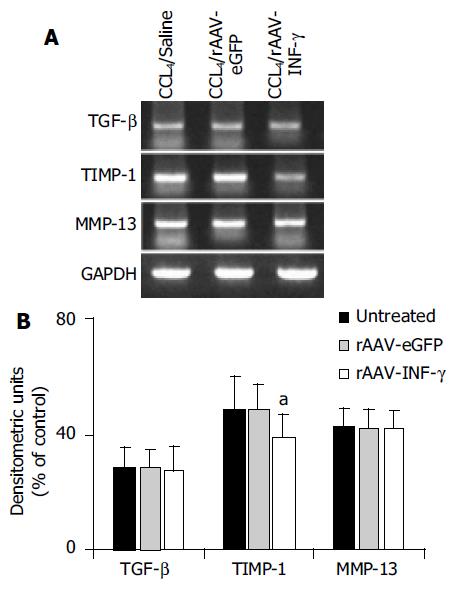
Figure 6 The mRNA expression of fibrosis related cytokines and proteases in different group of rat liver.
A: mRNA expressions of TGF-β, MMP-13 and TIMP-1 in the rat liver were examined by RT-PCR method; B: Densitometric units were calculated by dividing the density of individual bands by that of GAPDH. Closed column, untreated. Lined column, rAAV-eGFP induced. Dotted column, rAAV-INF-γ induced. (Data are mean±SD, n = 8, aP < 0.05).
- Citation: Chen M, Wang GJ, Diao Y, Xu RA, Xie HT, Li XY, Sun JG. Adeno-associated virus mediated interferon-gamma inhibits the progression of hepatic fibrosis in vitro and in vivo. World J Gastroenterol 2005; 11(26): 4045-4051
- URL: https://www.wjgnet.com/1007-9327/full/v11/i26/4045.htm
- DOI: https://dx.doi.org/10.3748/wjg.v11.i26.4045


