Copyright
©2005 Baishideng Publishing Group Inc.
World J Gastroenterol. Jun 14, 2005; 11(22): 3426-3430
Published online Jun 14, 2005. doi: 10.3748/wjg.v11.i22.3426
Published online Jun 14, 2005. doi: 10.3748/wjg.v11.i22.3426
Figure 1 Islets stained crimson with DTZ (A), purified by density gradient separation and hand-picking (B), and loss of color 2 h after islet staining (C) (×100).
Figure 2 Shape of islets culture in collagen gel (A ×100) and in monolayer (B ×200 ).
Figure 3 Islets of group 3 cystic transformed gradually in the process of culture.
A: d 1 in culture; B: d 3 in culture; C: d 5 in culture (inverted microscope ×100).
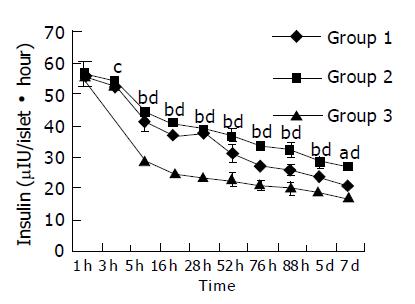
Figure 4 Insulin contents in culture media of three groups at different time points were detected using RIA.
(aP<0.05: group 1 vs group 3; bP<0.01: group 1 vs group 3; cP<0.05: group 2 vs group 3; dP<0.01: group 2 vs group 3).
Figure 5 Islets of group 3 stained for insulin by immunocytochemistry.
A: d 1 (strongly stain); B: d 3 (decreased stain); C: d 5 (lightly stain). (DAB stain and counterstained with hematine crystal ×100).
Figure 6 Islets of group 3 stain for cytokeratin 19.
A: d 1 (did not stain); B: d 3 (lightly stain); C: d 5 (strongly stain).
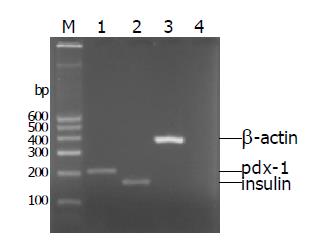
Figure 7 Pdx-1, insulin genes were expressed in freshly isolated islets, but cytokeratin 19 was not expressed (lane 1: Pdx-1; lane 2: Insulin; lane 3: β-actin; lane 4: cytokeratin 19).
Figure 8 Gene’s expression of islets of three groups cultured for 7 d; A: all of three groups expressed insulin; B: all of three groups expressed pdx-1; C: only group 3 expressed CK19 which group 1 and group 2 did not express.
- Citation: Lu J, Gu YP, Xu X, Liu ML, Xie P, Song HP. Adult islets cultured in collagen gel transdifferentiate into duct-like cells. World J Gastroenterol 2005; 11(22): 3426-3430
- URL: https://www.wjgnet.com/1007-9327/full/v11/i22/3426.htm
- DOI: https://dx.doi.org/10.3748/wjg.v11.i22.3426


