Copyright
©2005 Baishideng Publishing Group Inc.
World J Gastroenterol. Jun 14, 2005; 11(22): 3419-3425
Published online Jun 14, 2005. doi: 10.3748/wjg.v11.i22.3419
Published online Jun 14, 2005. doi: 10.3748/wjg.v11.i22.3419
Figure 1 The expression of Bax protein in sham-operated control group (A), 6 h after ischemia-reperfusion in group R (B) and 6 h after ischemia-reperfusion in group A (C).
Protein expression of Bax was weak in sham-operated control group. Bax was strongly expressed in villus at 6 h after reperfusion, and was mainly localized in the whole constitutive cells of villus. The positive stained cells decreased remarkably at 6 h after reperfusion in group A vs group R.
Figure 2 The expression of bcl-2 protein in sham-operated control group (A), 6 h after ischemia-reperfusion in group R (B) and 6 h after ischemia-reperfusion in group A (C) bcl-2 was strongly expressed in the sham-operated intestinal tissues and positive particles of bcl-2 were mainly localized in the lower half of the villus and in the cytoplasm and nuclei of villus cells.
bcl-2 expression level decreased at 6 h after reperfusion in group R. Compared with group R, the positive cellular rates of bcl-2 were significantly higher at 6 h after reperfusion in group C.
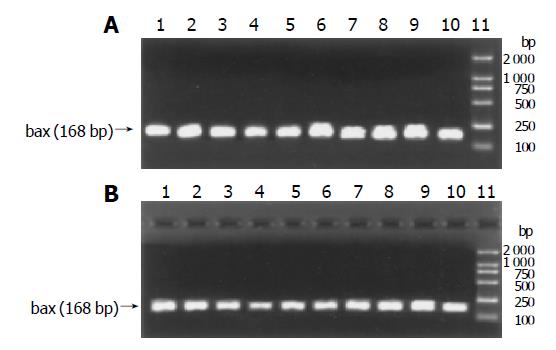
Figure 3 Expression of bax gene in normal saline treated (A) and aFGF treated (B) rat intestinal villus.
Bar indicates the size of RT-PCR cDNA products. 1: 48 h after reperfusion, 2: 24 h after reperfusion, 3: 12 h after reperfusion, 4: 6 h after reperfusion, 5: 2 h after reperfusion, 6: 1 h after reperfusion, 7: 30 min after reperfusion, 8: 15 min after reperfusion, 9: ischemia group, 10: sham-operated control group, 11: DL2000 marker.
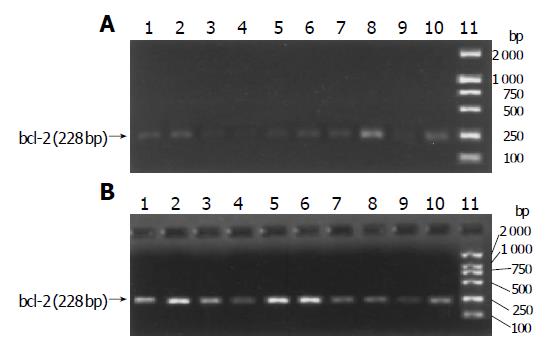
Figure 4 Expression of bax gene in normal saline treated (A) and aFGF treated(B) rat intestinal villus.
Bar indicates the size of RT-PCR cDNA products. 1: 48 h after reperfusion, 2: 24 h after reperfusion, 3: 12 h after reperfusion, 4: 6 h after reperfusion, 5: 2 h after reperfusion, 6: 1 h after reperfusion, 7: 30 min after reperfusion, 8: 15 min after reperfusion, 9: ischemia group, 10: sham-operated control group, 11: DL2000 marker.
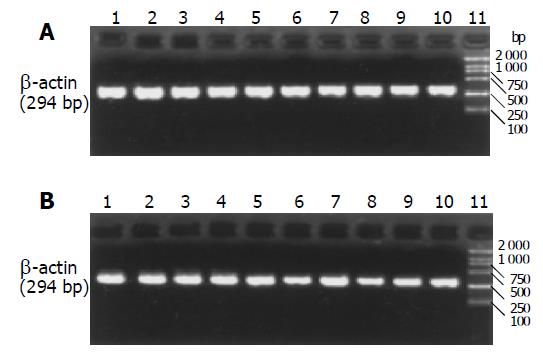
Figure 5 Expression of β-actin gene in normal saline treated (A) and aFGF treated (B) rat intestinal villus.
Bar indicates the size of RT-PCR cDNA products. 1: 48 h after reperfusion, 2: 24 h after reperfusion, 3: 12 h after reperfusion, 4: 6 h after reperfusion, 5: 2 h after reperfusion, 6: 1 h after reperfusion, 7: 30min after reperfusion, 8: 15 min after reperfusion, 9: ischemia group, 10: sham-operated control group, 11: DL2000 marker.
- Citation: Chen W, Fu XB, Ge SL, Sun TZ, Zhou G, Han B, Du YR, Li HH, Sheng ZY. Intravenous acid fibroblast growth factor protects intestinal mucosal cells against ischemia-reperfusion injury via regulating Bcl-2/Bax expression. World J Gastroenterol 2005; 11(22): 3419-3425
- URL: https://www.wjgnet.com/1007-9327/full/v11/i22/3419.htm
- DOI: https://dx.doi.org/10.3748/wjg.v11.i22.3419


