Copyright
©2005 Baishideng Publishing Group Inc.
World J Gastroenterol. Jun 14, 2005; 11(22): 3339-3345
Published online Jun 14, 2005. doi: 10.3748/wjg.v11.i22.3339
Published online Jun 14, 2005. doi: 10.3748/wjg.v11.i22.3339
Figure 1 Morphological change of Bel-7402 during induction of drug-resistance.
A: Parent cells; B: morphology change during culture; C: most of the cells died. Some “normal” cell islands appeared.
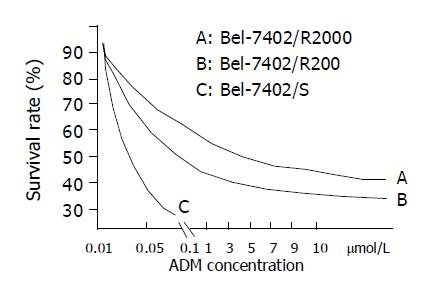
Figure 2 Survival-ADM concentration curves of three cells.
A: Bel-7402/R-2000; B: Bel-7402/R-200; C: Bel-7402/S.
Figure 3 Rhodamine 123 excluding test detected by FCM.
A: Control; B: Bel7402/r-2000; C: Bel7402/r-200; D: Bel7402/S.
Figure 4 Indirect immunofluorescence on Pgp detected by FCM.
A: Bel7402/s; B: Bel7402/r-200; C: Bel7402/r-2000.
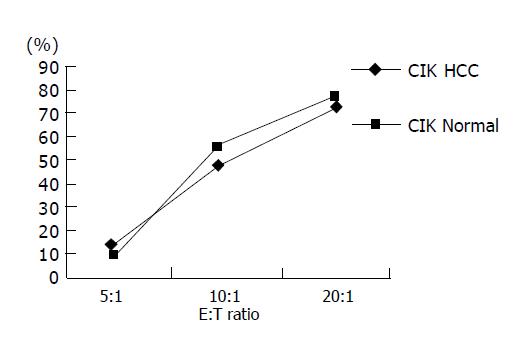
Figure 5 Cytotoxicity of CIK to Bel-7402 at different E:T ratios.
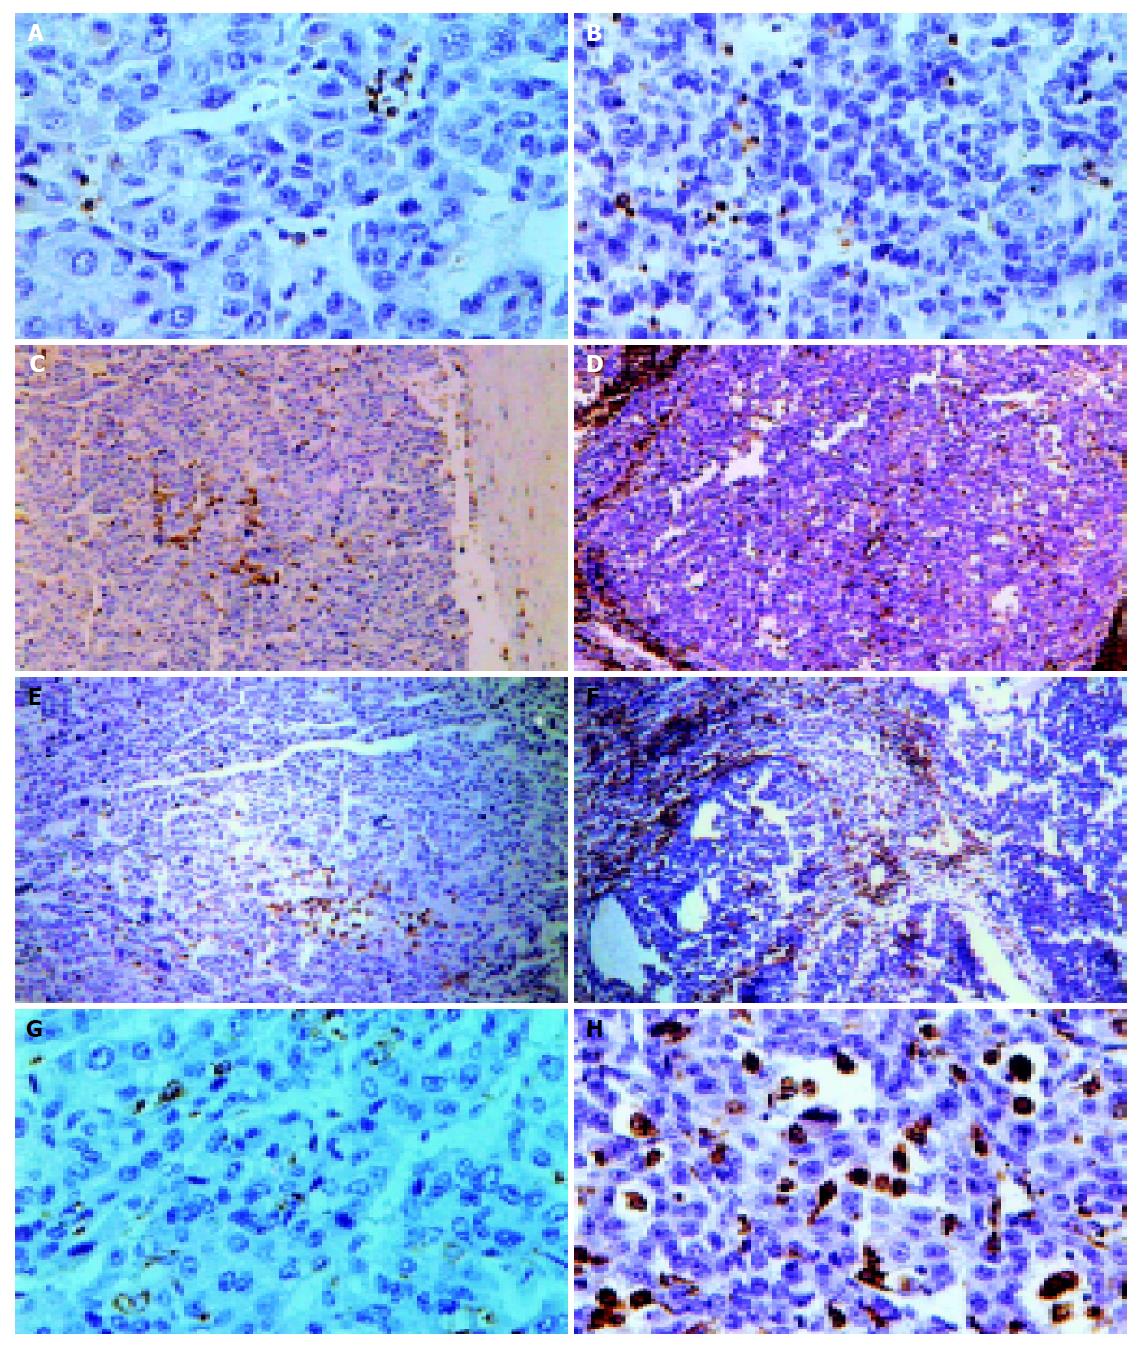
Figure 6 Immunohistochemistry results of the tumor specimen before and after CIK treatment, demonstrated that a large amount of lymphocytes with CD3, CD45, CD45RO, CD68 markers infiltrated in tumor after treatment.
A: Immunohistochemistry with anti-CD3 to the specimen before treatment; B: with anti-CD3 to the specimen after treatment; C: immunohistochemistry with anti-CD45 to the specimen before treatment; D: with anti-CD45 to the specimen after treatment; E: immunohistochemistry with anti-CD45RO to the specimen before treatment; F: with anti-CD45RO to the specimen after treatment; G: immunohistochemistry with anti-CD68 to the specimen before treatment; H: with anti-CD68 to the specimen after treatment.
- Citation: Zhang YS, Yuan FJ, Jia GF, Zhang JF, Hu LY, Huang L, Wang J, Dai ZQ. CIK cells from patients with HCC possess strong cytotoxicity to multidrug-resistant cell line Bel-7402/R. World J Gastroenterol 2005; 11(22): 3339-3345
- URL: https://www.wjgnet.com/1007-9327/full/v11/i22/3339.htm
- DOI: https://dx.doi.org/10.3748/wjg.v11.i22.3339


