Copyright
©2005 Baishideng Publishing Group Inc.
World J Gastroenterol. May 28, 2005; 11(20): 3144-3146
Published online May 28, 2005. doi: 10.3748/wjg.v11.i20.3144
Published online May 28, 2005. doi: 10.3748/wjg.v11.i20.3144
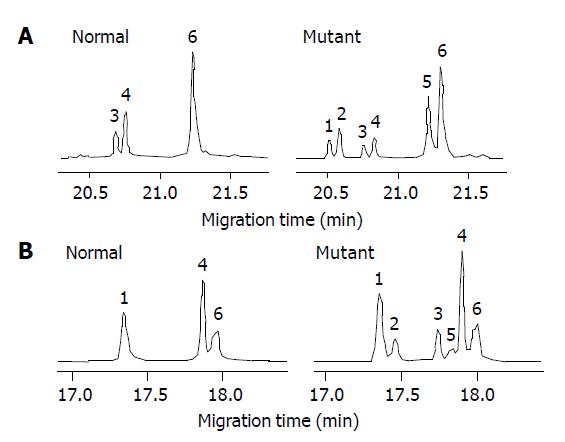
Figure 1 SSCP analysis of the normal and mutant samples of hMLH1 gene exon 8 (A) and exon 12 (B).
Peaks 3, 4, 6- wild type ssDNA and peaks 1, 2, 5-mutant ssDNA for exon 8 (A); Peaks 1, 4-wild type ssDNA, peaks 2, 3-mutant ssDNA and peaks 5, 6-primer ssDNA for exon 12 (B).
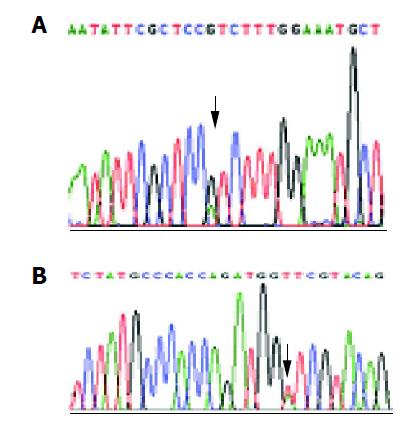
Figure 2 Electrophorogram section of CE-sequencing of hMLH1 gene exon 8 (A) and exon 12 (B).
Arrow: substitution of A-G (A) and T-A (B).
- Citation: Li JH, Shi XZ, Lü S, Liu M, Cui WM, Liu LN, Jiang J, Xu GW. HMLH1 gene mutation in gastric cancer patients and their kindred. World J Gastroenterol 2005; 11(20): 3144-3146
- URL: https://www.wjgnet.com/1007-9327/full/v11/i20/3144.htm
- DOI: https://dx.doi.org/10.3748/wjg.v11.i20.3144


