Copyright
©2005 Baishideng Publishing Group Inc.
World J Gastroenterol. May 28, 2005; 11(20): 3020-3026
Published online May 28, 2005. doi: 10.3748/wjg.v11.i20.3020
Published online May 28, 2005. doi: 10.3748/wjg.v11.i20.3020
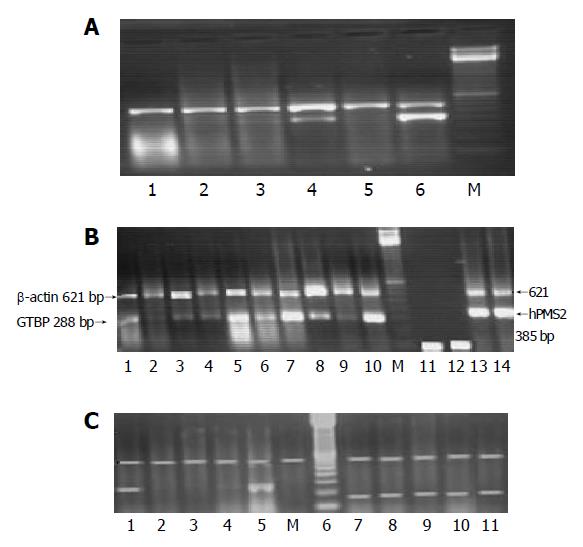
Figure 1 A: PCR amplification for MMR genes.
A: Multiplex RT-PCR of hMSH2 gene in some HCC cases. M: 100-bp marker; lanes 1-6: hMSH2 co-amplified with β-actin in HCC cases; lanes 1-3 and 5: hMSH2 reduction; lane 4: 50 reduced expression of hMSH2; lane 6: hMSH2 co-amplified with β-actin gene in normal PBL as a control. The accepted band of β-actin was at 621 and 492 bp for hMSH2. B: Multiplex RT-PCR of GTBP and hPMS2 genes in some HCC cases. M: 100-bp marker; lanes 1-10: GTBP co-amplified with β-actin in HCC cases; lanes 1 and 6: no reduction; lanes 2, 3, 4, 8 and 9: different expression levels of GTBP gene; lane 5: GTBP co-amplified with β-actin gene in normal PBL as a control; lane 10: overexpression of GTBP; lane 11: GTBP co-amplified with β-actin without NA as reagent control; lane 12: hPMS2 co-amplified with β-actin without NA as reagent control; lanes 13 and 14: overexpression of hPMS2. C: Multiplex RT-PCR of hMLH1 and hPMS1 genes in HCC cases. Lane 1: hMLH1 co-amplified with β-actin gene in normal PBL as a control; lanes 2, 3 and 6: reduced expression of hMLH1 gene; lane 5: overexpression of hMLH1. M: 100-bp marker; lanes 7-10: hPMS1 co-amplified with β-actin gene in HCC cases with no changes on the expression level.
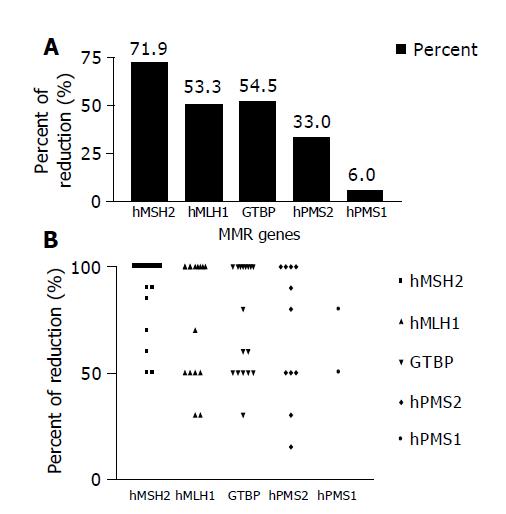
Figure 2 Reduced expression of five studied MMR genes.
A: Percent of reduction of five studied MMR genes in HCC cases; B: percent of reduction of the five MMR genes in each of the studied HCC cases.
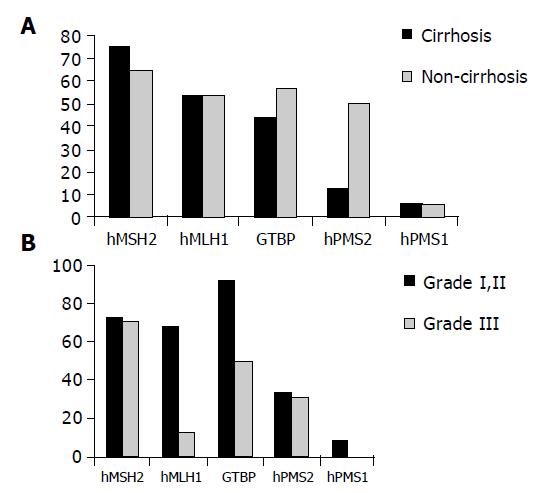
Figure 3 Relation between the five studied MMR genes and cirrhosis (A) and grade (B) of HCC.
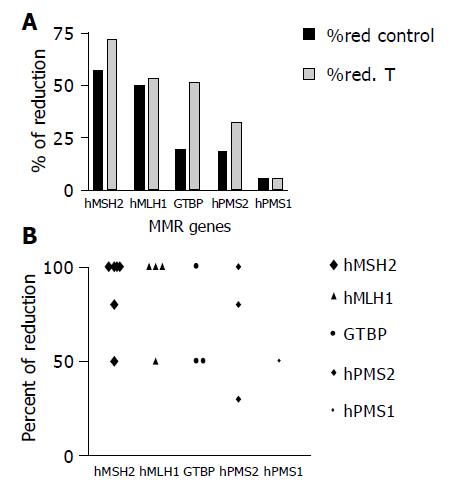
Figure 4 Expression levels of MMR genes in NDHT.
Percent of reduction of the five studied MMR genes in HCC cases (A) each of the studied normal liver tissues distant to tumor (B).
-
Citation: Zekri ARN, Sabry GM, Bahnassy AA, Shalaby KA, Abdel-Wahabh SA, Zakaria S. Mismatch repair genes (
hMLH1 ,hPMS1 ,hPMS2 ,GTBP/hMSH6 ,hMSH2 ) in the pathogenesis of hepatocellular carcinoma. World J Gastroenterol 2005; 11(20): 3020-3026 - URL: https://www.wjgnet.com/1007-9327/full/v11/i20/3020.htm
- DOI: https://dx.doi.org/10.3748/wjg.v11.i20.3020


