Copyright
©2005 Baishideng Publishing Group Inc.
World J Gastroenterol. May 21, 2005; 11(19): 2941-2944
Published online May 21, 2005. doi: 10.3748/wjg.v11.i19.2941
Published online May 21, 2005. doi: 10.3748/wjg.v11.i19.2941
Figure 1 PCNA in transplanted rat liver SABC, ×400.
Group A: 18.6±3.2% vs group B: 22±3.5% vs group C: 28.2±4.2%.
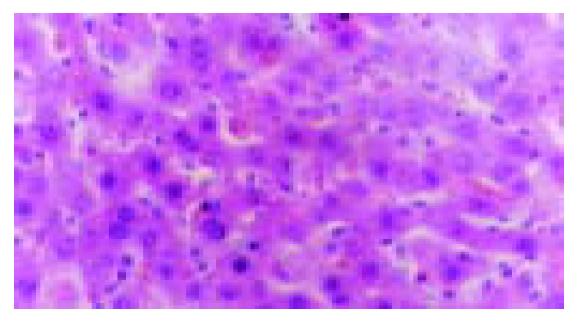
Figure 2 HE staining: the deeper staining nuclei and double nuclei in group C, HE ×400.
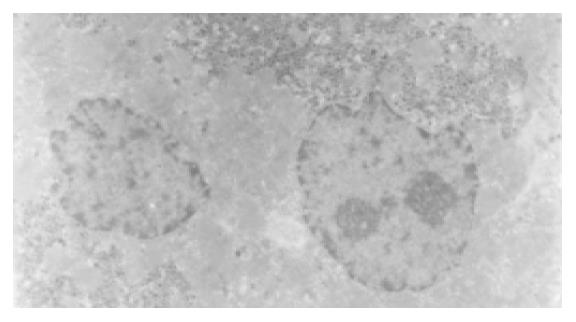
Figure 3 Double nuclei and much glycogen of hepatocyte in group C, TCM×1500.
- Citation: Meng KW, Lv Y, Yu L, Wu SL, Pan CE. Effects of emodin and double blood supplies on liver regeneration of reduced size graft liver in rat model. World J Gastroenterol 2005; 11(19): 2941-2944
- URL: https://www.wjgnet.com/1007-9327/full/v11/i19/2941.htm
- DOI: https://dx.doi.org/10.3748/wjg.v11.i19.2941


