Copyright
©2005 Baishideng Publishing Group Inc.
World J Gastroenterol. May 21, 2005; 11(19): 2927-2931
Published online May 21, 2005. doi: 10.3748/wjg.v11.i19.2927
Published online May 21, 2005. doi: 10.3748/wjg.v11.i19.2927
Figure 1 Time-and dose-dependent effect of syl-155 on the cell growth of the three tumor cell lines.
All the three cell lines were treated with either syl-155 at different concentrations (2.5, 5.0, 10 μg/mL) or 0.2 mL/L DMSO. MTT method was employed at the indicated time for analyses of cell growth. The experiments were performed in triplicate, and similar results were obtained from three independent experiments. The data were expressed as mean±SD. A: HT1080; B: KYSE510; C: MG63.
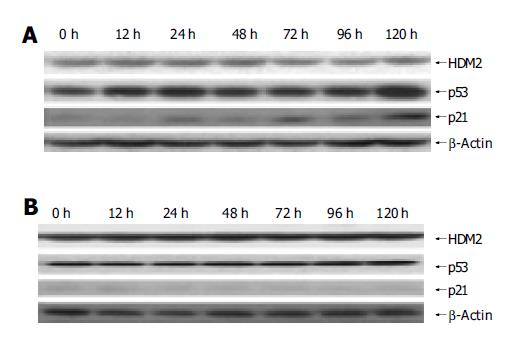
Figure 2 Expression of HDM2, p53 and p21 proteins in HT1080 cells (A) and KYSE510 cells (B) induced by syl-155.
The HT1080 cells were harvested at the indicated time after treatment with 10 μg/mL syl-155, and then protein was extracted for Western blot. HDM2, p53, p21 and β-actin proteins were detected using mouse monoclonal antibodies DO-1, D-12, DO-1, F-5 and anti-β-actin antibody as primary antibodies, respectively.
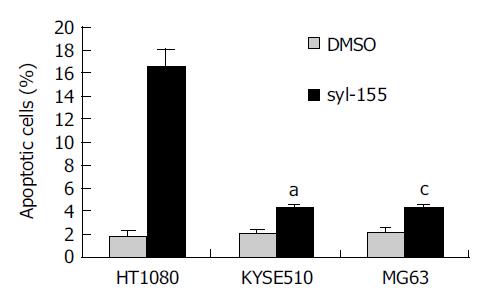
Figure 3 Syl-155-induced apoptosis of tumor cells.
All the three cell lines were incubated with 0.2 mL/L DMSO or 10 μg/mL syl-155 for 3 d, stained with PI, and analyzed by flow cytometry to quantitate cells with a subdiploid DNA content. The data were expressed as mean±SD, aP<0.05 vs HT1080 group, cP<0.05 vs HT1080 group.
Figure 4 Syl-155-induced apoptosis of HT1080 cells.
Time course analysis for the occurrence of apoptosis induced by syl-155. HT1080 cells were treated with 10 μg/mL syl-155 for 0-72 h, stained with PI, and analyzed by flow cytometry to quantitate cells with a subdiploid DNA content. The data were expressed as mean±SD, aP<0.05 vs DMSO group, cP<0.05 vs DMSO group, eP<0.05 vs DMSO group.
- Citation: Li WD, Wang MJ, Ding F, Yin DL, Liu ZH. Cytotoxic effect of a non-peptidic small molecular inhibitor of the p53-HDM2 interaction on tumor cells. World J Gastroenterol 2005; 11(19): 2927-2931
- URL: https://www.wjgnet.com/1007-9327/full/v11/i19/2927.htm
- DOI: https://dx.doi.org/10.3748/wjg.v11.i19.2927


