Copyright
©2005 Baishideng Publishing Group Inc.
World J Gastroenterol. May 21, 2005; 11(19): 2922-2926
Published online May 21, 2005. doi: 10.3748/wjg.v11.i19.2922
Published online May 21, 2005. doi: 10.3748/wjg.v11.i19.2922
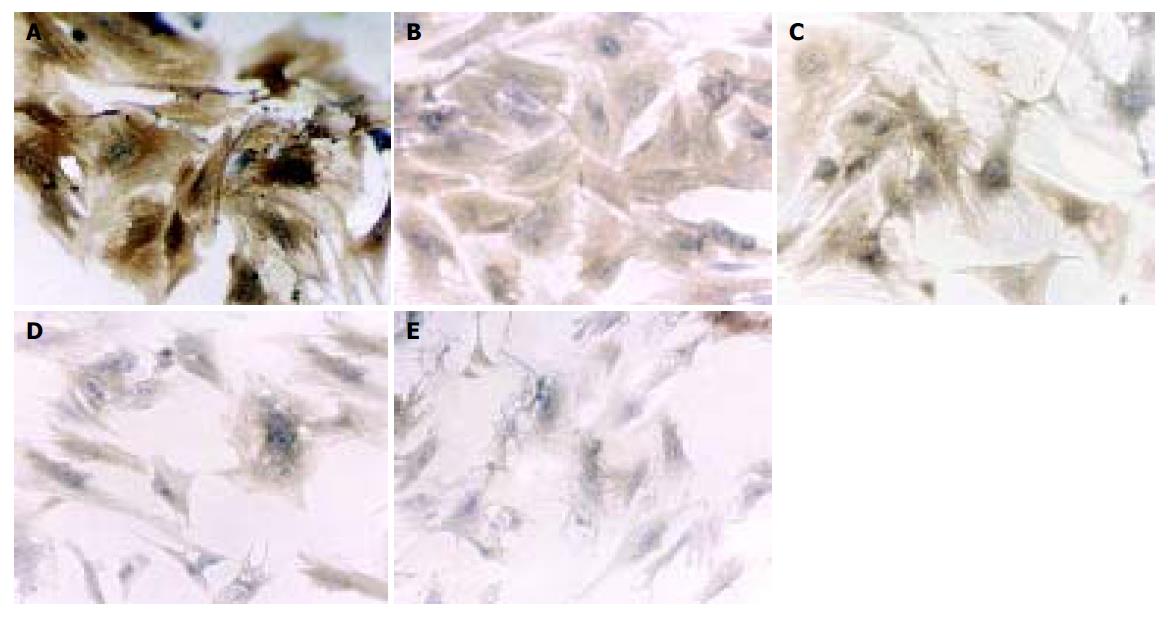
Figure 1 Immunocytochemistry analysis of α-SMA of HSCs subjected to different treatment of tetrandrine (magnification ×200).
A: control; B: tetrandrine 0.25 mg/L; C: tetrandrine 0.5 mg/L; D: tetrandrine 1 mg/L; E: tetrandrine 2 mg/L.
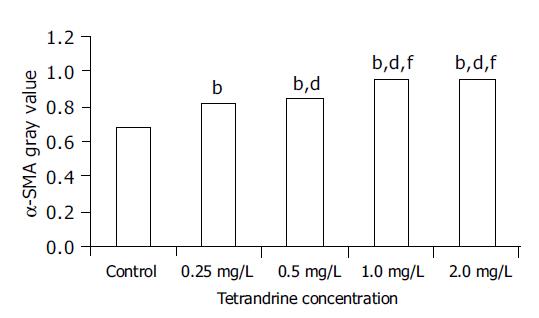
Figure 2 Expression of α-SMA in culture-activated HSCs.
bP<0.01 vs control group. dP<0.01 vs tetrandrine 0.25 mg/L group. fP<0.01 vs tetrandrine 0.25, 0.5 mg/L groups.
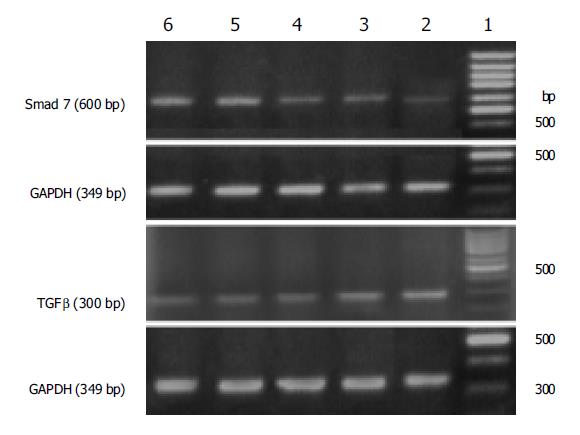
Figure 3 RT-PCR determination of Smad 7 and TGF-β1 mRNA expressions.
Lane 1: 100-bp marker, lane 2: control group, lanes 3-6: treatment with tetrandrine at 0.25, 0.5, 1.0, 2.0 mg/L, respectively.
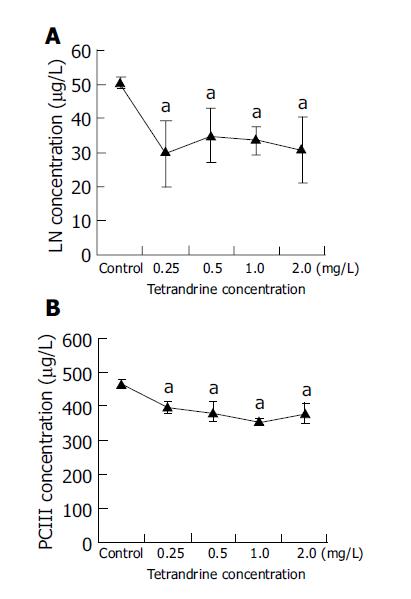
Figure 4 Radioimmunoassay of LN and PCIII.
aP<0.05 vs control group.
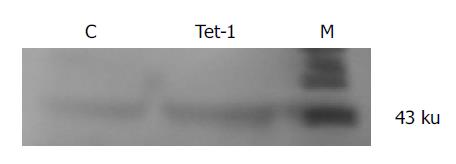
Figure 5 Immunoblot analysis for Smad 7.
C: control group, Tet-1: treatment with tetrandrine at 1 mg/L, M: protein marker.
- Citation: Chen YW, Wu JX, Chen YW, Li DG, Lu HM. Tetrandrine inhibits activation of rat hepatic stellate cells in vitro via transforming growth factor-β signaling. World J Gastroenterol 2005; 11(19): 2922-2926
- URL: https://www.wjgnet.com/1007-9327/full/v11/i19/2922.htm
- DOI: https://dx.doi.org/10.3748/wjg.v11.i19.2922


