Copyright
©2005 Baishideng Publishing Group Inc.
World J Gastroenterol. May 7, 2005; 11(17): 2643-2646
Published online May 7, 2005. doi: 10.3748/wjg.v11.i17.2643
Published online May 7, 2005. doi: 10.3748/wjg.v11.i17.2643
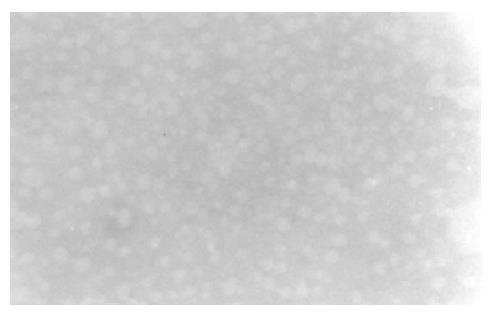
Figure 1 5-Fu-GCL; TEM ×4000.
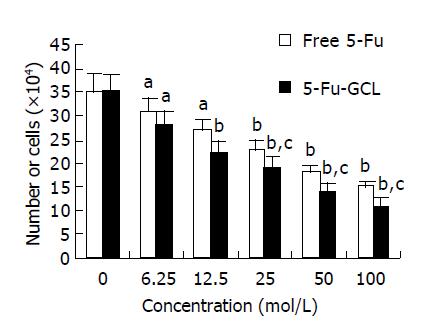
Figure 2 Effects of various concentrations of 5-Fu-GCL on the proliferation of HepA cells analyzed by cell counts.
aP<0.05, bP<0.01 vs control. cP<0.05 vs free 5-Fu (mean±SD, n = 5).
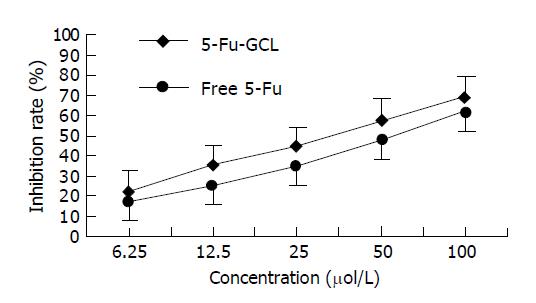
Figure 3 Effects of various concentrations of 5-Fu-GCL on the rate of cell growth inhibition of HepA cells analyzed by MTT assay (mean±SD, n = 5).
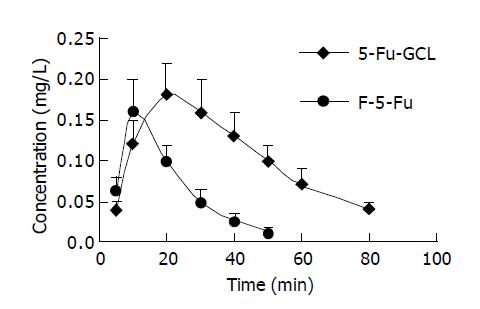
Figure 4 Concentration-time course of 5-Fu-GCL in intracellular fluid of HepA cells analyzed by HPLC assay (mean±SD, n = 5).
Figure 5 Results of flow cytometry analysis of HepA cells treated with Fu-GCL for 48 h and DNA content was determined by flow cytometry (mean±SD, n = 5).
A: control; B: 5-Fu-GCL; C: free 5-Fu; D: apoptosis percentage of HepA cells treated with Fu-GCL. aP<0.05 vs 5-F-Fu.
Figure 6 Effects of 5-Fu-GCL on cell cycle phase distribution (mean±SD, n = 5).
aP<0.05, bP<0.01 vs control. cP<0.05 vs free 5-Fu. A: G0/G1 phase; B: S phase; C: G2/M phase.
- Citation: Jin Y, Li J, Rong LF, Li YH, Guo L, Xu SY. Anti-hepatocarcinoma effects of 5-fluorouracil encapsulated by galactosylceramide liposomes in vivo and in vitro. World J Gastroenterol 2005; 11(17): 2643-2646
- URL: https://www.wjgnet.com/1007-9327/full/v11/i17/2643.htm
- DOI: https://dx.doi.org/10.3748/wjg.v11.i17.2643


