Copyright
©2005 Baishideng Publishing Group Inc.
World J Gastroenterol. May 7, 2005; 11(17): 2557-2563
Published online May 7, 2005. doi: 10.3748/wjg.v11.i17.2557
Published online May 7, 2005. doi: 10.3748/wjg.v11.i17.2557
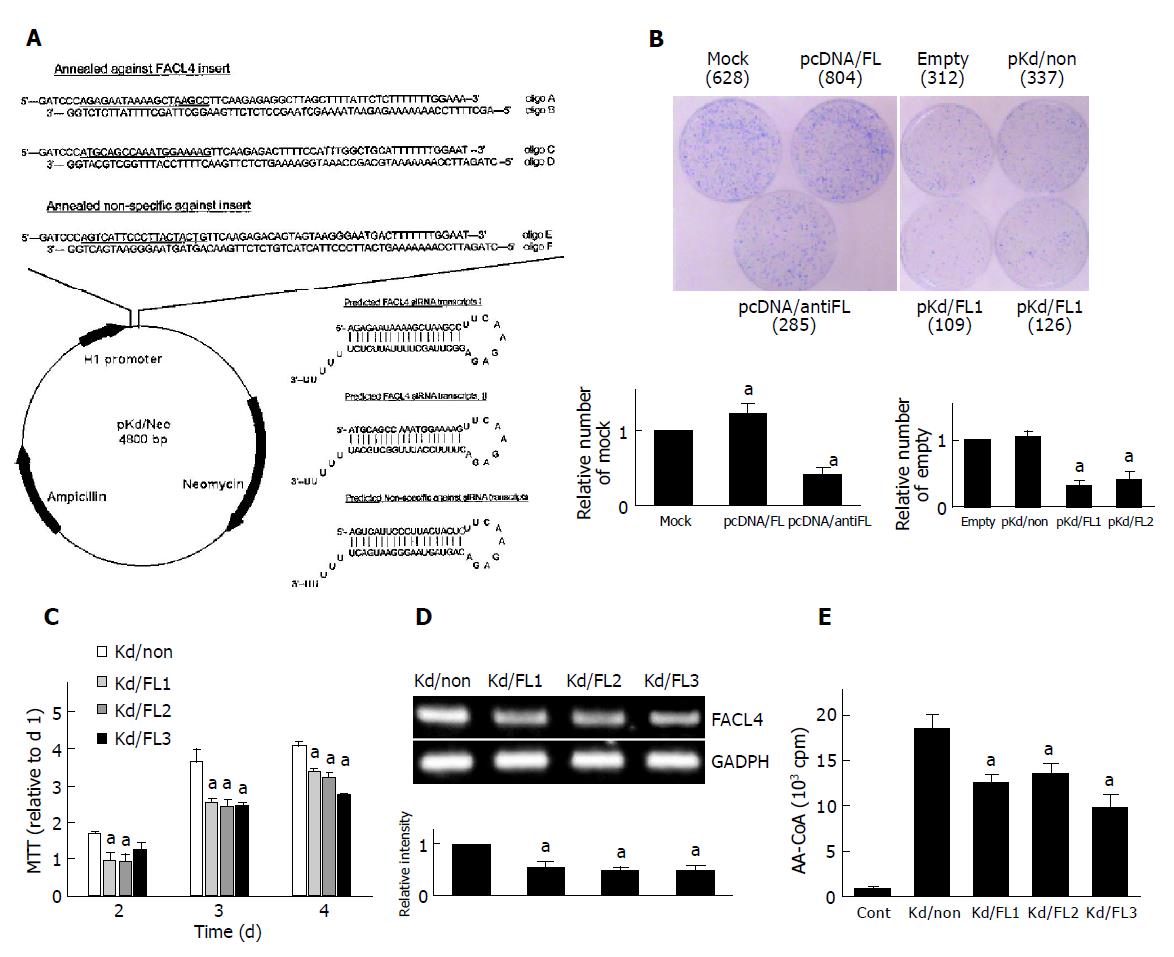
Figure 2 Growth inhibition of Hep3B cells by FACL4 knockdown (A) siRNA expression construction and predicated siRNA transcripts.
(B) Colony formation assay. aP<0.05 vs mock or empty. pcDNA/FL, sense expression plasmid; pcDNA/antiFL, FACL4 antisense expression plasmid; pKd/non, non-specific siRNA expression plasmid; pKd/FL, FACL4 siRNA expression plasmid. (C-E) Cells transfected with pKd/non or pKd/FL2 plasmid and selected neomycin-resistant clones.
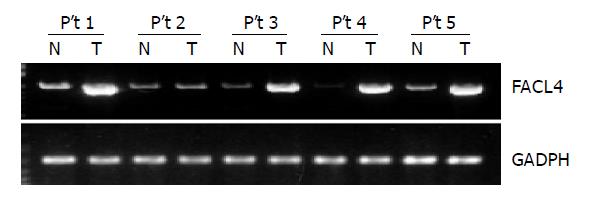
Figure 1 Up-regulation of FACL4 expression in HCC.
P’t, patients; T, tumor from HCC; N, normal liver tissue from the same patient.
Figure 3 Effect of cAMP on the expression of FACL4 in Hep3B cells (A) and on the inhibition of p38 in Hep3B cells (B).
In Figure 3B, a: total p38 proteins and the phorphorylated p38 by Western blot; b: the p38 kinase activity by in vitro kinase assay. aP<0.05 vs control.
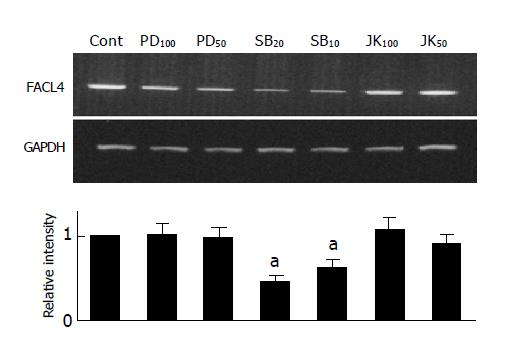
Figure 4 Effect of p38 inhibitor on the expression of FACL4 in Hep3B cells.
aP<0.05 vs control.
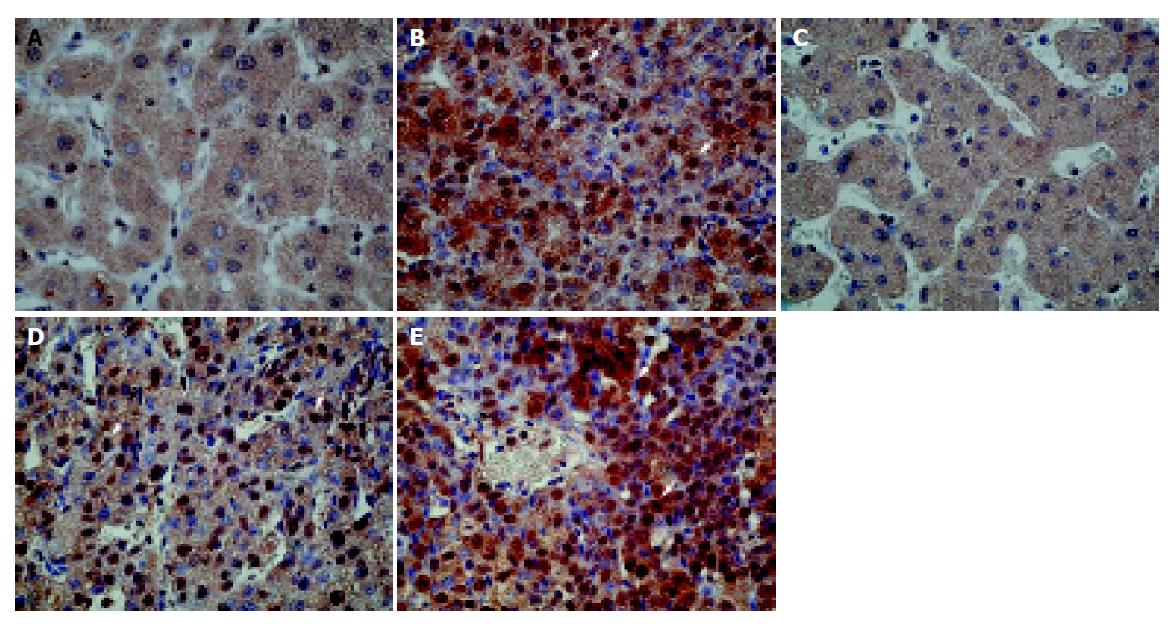
Figure 5 Up-regulation of phosphorylated p38 in human HCC.
HCC tumor tissues (B, D, and E) and the non-cancerous tissues (A and C) were analyzed for the phosphorylated p38 (p-p38) by immunohistochemistry staining. Green arrows indicate the representative p-p38 immunoreactive cells (brown) (400×).
- Citation: Liang YC, Wu CH, Chu JS, Wang CK, Hung LF, Wang YJ, Ho YS, Chang JG, Lin SY. Involvement of fatty acid-CoA ligase 4 in hepatocellular carcinoma growth: Roles of cyclic AMP and p38 mitogen-activated protein kinase. World J Gastroenterol 2005; 11(17): 2557-2563
- URL: https://www.wjgnet.com/1007-9327/full/v11/i17/2557.htm
- DOI: https://dx.doi.org/10.3748/wjg.v11.i17.2557


