Copyright
©2005 Baishideng Publishing Group Inc.
World J Gastroenterol. Apr 28, 2005; 11(16): 2390-2397
Published online Apr 28, 2005. doi: 10.3748/wjg.v11.i16.2390
Published online Apr 28, 2005. doi: 10.3748/wjg.v11.i16.2390
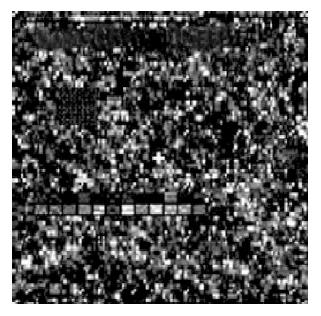
Figure 1 Control cRNA vs test chip post-hybridization.
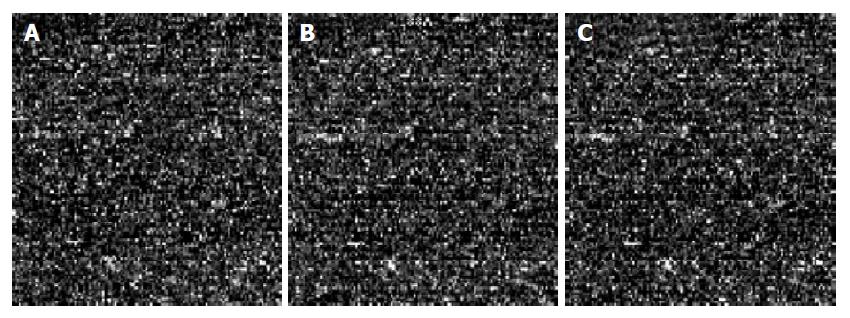
Figure 2 Hybridization results of the sample chip of scanning results.
A: Post-hybridization of scanning results in control cRNA vs U133A chip; B: Post-hybridization of scanning results in gastric cancer group cRNA vs U133A chip; C: Post-hybridization of scanning results in pericancerous group cRNA vs U133A chip.
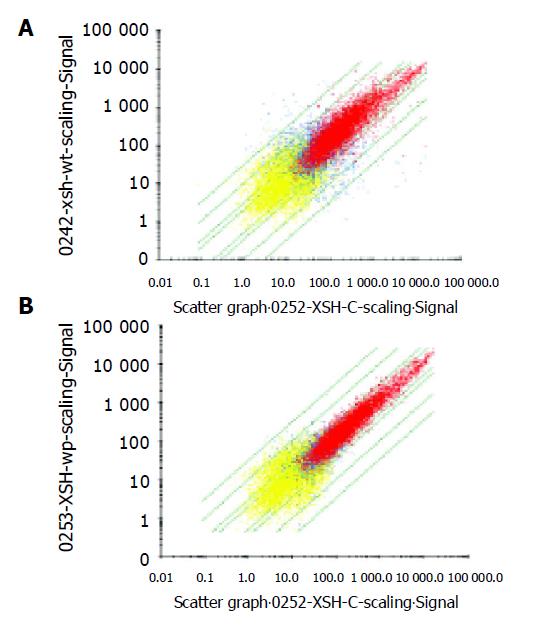
Figure 3 Scatter plots in gastric cancer and pericancerous tissues A: Scatter plots in gastric cancer tissue vs control B: Scatter plots in pericancerous tissue vs control.
- Citation: Yu CD, Xu SH, Mou HZ, Jiang ZM, Zhu CH, Liu XL. Gene expression profile differences in gastric cancer, pericancerous epithelium and normal gastric mucosa by gene chip. World J Gastroenterol 2005; 11(16): 2390-2397
- URL: https://www.wjgnet.com/1007-9327/full/v11/i16/2390.htm
- DOI: https://dx.doi.org/10.3748/wjg.v11.i16.2390


