Copyright
©2005 Baishideng Publishing Group Inc.
World J Gastroenterol. Apr 21, 2005; 11(15): 2255-2259
Published online Apr 21, 2005. doi: 10.3748/wjg.v11.i15.2255
Published online Apr 21, 2005. doi: 10.3748/wjg.v11.i15.2255
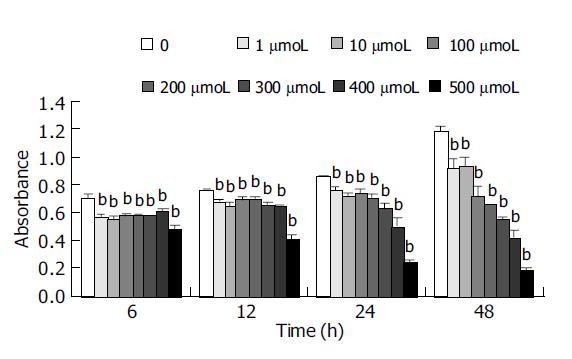
Figure 1 Inhibition of proliferation of HCT cells by Verapamil.
Results were expressed as mean±SD n = 9 bP<0.01 vs control.
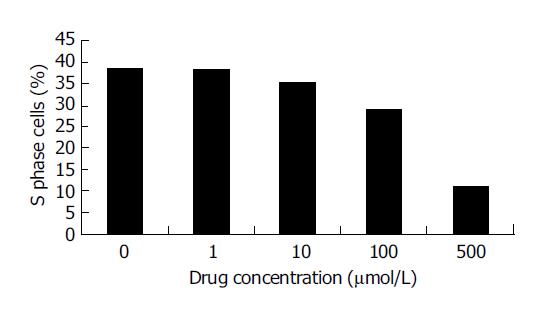
Figure 2 The percentage of S phase HCT cells treated with Verapamil.
With increase in Verapamil concentration, the percent of S phase cells was decreased as detected by flow cytometry.
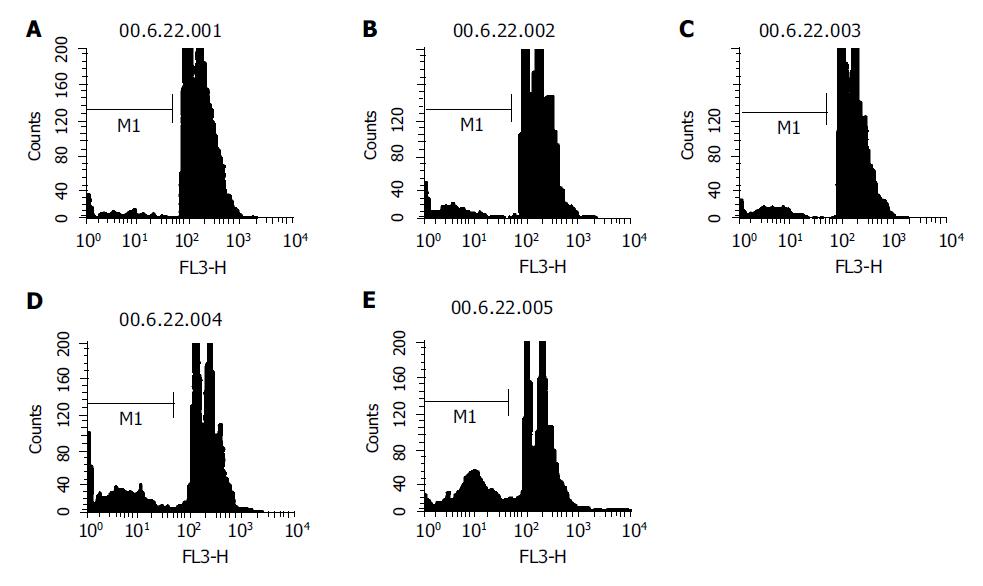
Figure 3 Flow cytometry detection of HCT cells apoptosis.
The percentage of apoptotic cells increased as Verapamil concentration increased. A: control; B: 1 μmol/L Verapamil; C: 10 μmol/L Verapamil; D: 100 μmol/L Verapamil; E: 500 μmol/L Verapamil.
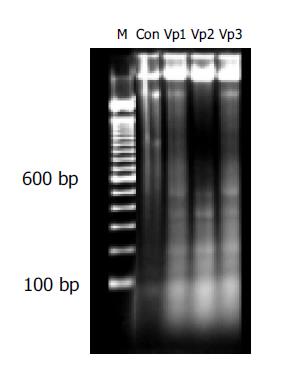
Figure 4 DNA Ladder of HCT cell line treated with Verapamil.
M: marker (100 bp DNA Ladder); Con: control; Vp1: 100 μmol/L Verapamil; Vp2: 200 μmol/L Verapamil; Vp3: 400 μmol/L Verapamil.
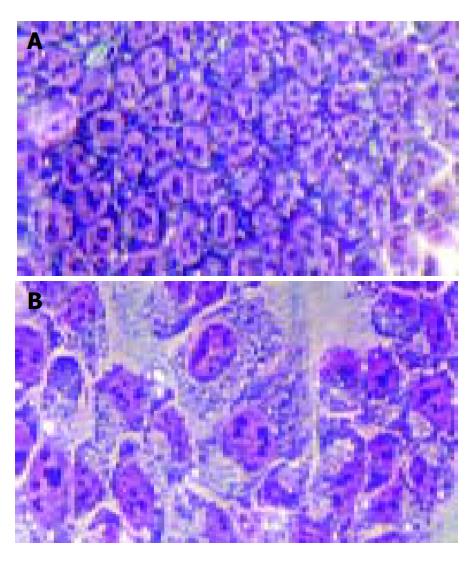
Figure 5 Cellular morphologic changes (400×).
Cell membrane blebs and the cytoplasm and nuclear chromatin condensation in HCT cells treated with Verapamil were observed. A: control cells; B: 100 μmol/L Verapamil.
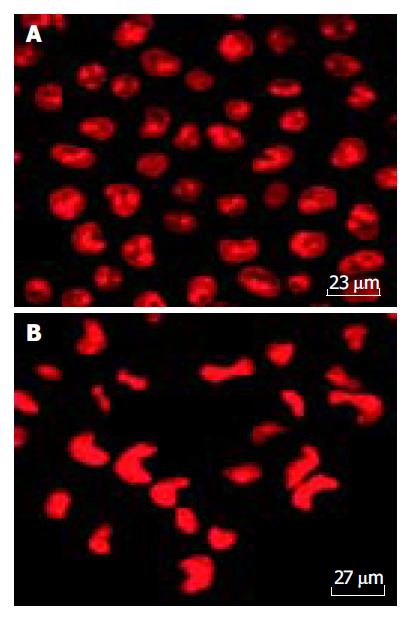
Figure 6 Nuclear model change as reniform and nuclear chromatin condensation in HCT cell line treated with Verapamil and labeled with PI (400×).
A: Control cells; B: 100 μmol/L Verapamil.
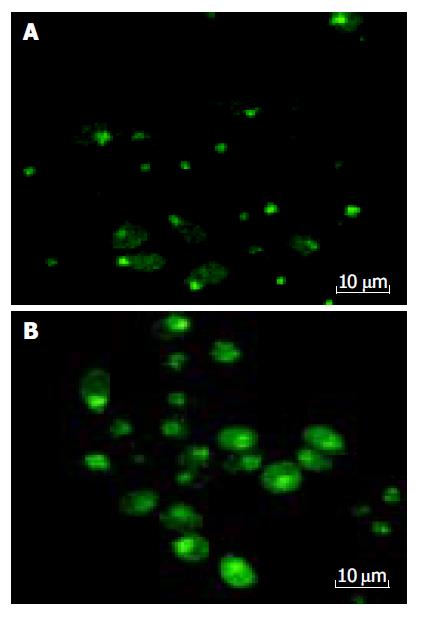
Figure 7 Influence of Verapamil on [Ca2+]i intensity in HCT cell after 12 h (400×).
100 μmol/L. A: Control cells; B: 100 μmol/L Verapamil.
-
Citation: Cao QZ, Niu G, Tan HR.
In vitro growth inhibition of human colonic tumor cells by Verapamil. World J Gastroenterol 2005; 11(15): 2255-2259 - URL: https://www.wjgnet.com/1007-9327/full/v11/i15/2255.htm
- DOI: https://dx.doi.org/10.3748/wjg.v11.i15.2255


