Copyright
©2005 Baishideng Publishing Group Inc.
World J Gastroenterol. Apr 14, 2005; 11(14): 2130-2135
Published online Apr 14, 2005. doi: 10.3748/wjg.v11.i14.2130
Published online Apr 14, 2005. doi: 10.3748/wjg.v11.i14.2130
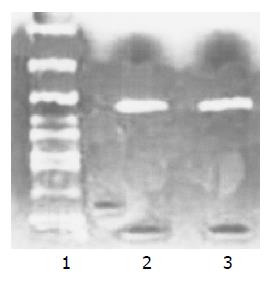
Figure 1 p27 gene amplified from PMC and K562 by RT-PCR.
Lane1: DGL2000 DNA marker, Lane2: P27 gene amplified from peripheral-blood mononuclear cells (about 750 bp), and lane3: P27 gene amplified from K562 cells.
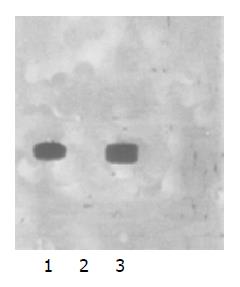
Figure 2 p27 gene deletion in K562 cells proved by Southern blot.
Lane1: Positive (P27 gene probe hybridized with PMC), lane2: Negative (P27 gene probe hybridized with K562 cells), and lane3: Positive (P27 gene probe hybridized with stomach tissue).
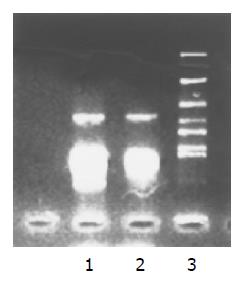
Figure 3 Digestion pattern of P27-pcDNA3.
1 vector with EcoRI and HindIII. Lane1: Digestion pattern of P21-K562-pcDNA3.1 vector (about 600 bp); Lane2: Digestion pattern of P21-PMC-pcDNA3.1 vector (about 600 bp); and lane3: DGL2000 DNA marker.
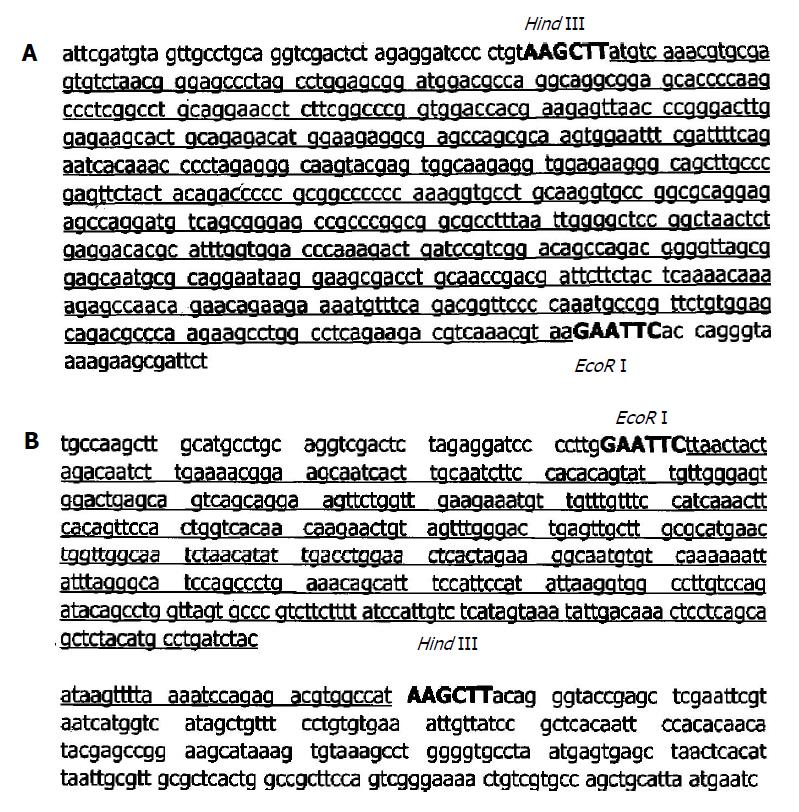
Figure 4 Gene sequences in p27-PMC-pcDNA3.
1 vector (A) p27-K562-pcDNA3.1 vector (B).
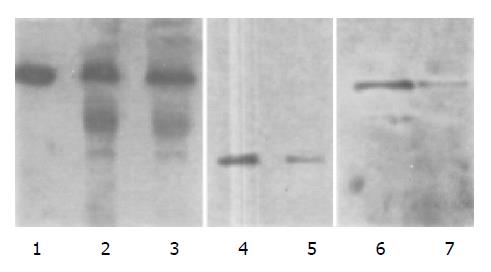
Figure 5 Expressions of p27 and cyclin-E protein observed by Western blot 1: positive control of β-actin; 2: control of β-actin in K562 cells; 3: β-actin in p27-pcDNA3.
1-K562 cells; 4: Positive control of p27; 5: positive expression of p27 in P27-pcDNA3.1-K562 cells; 6: positive expression of cyclin-E in K562 cells; 7: decrease of cyclin-E in P27-pcDNA3.1-K562 cells.
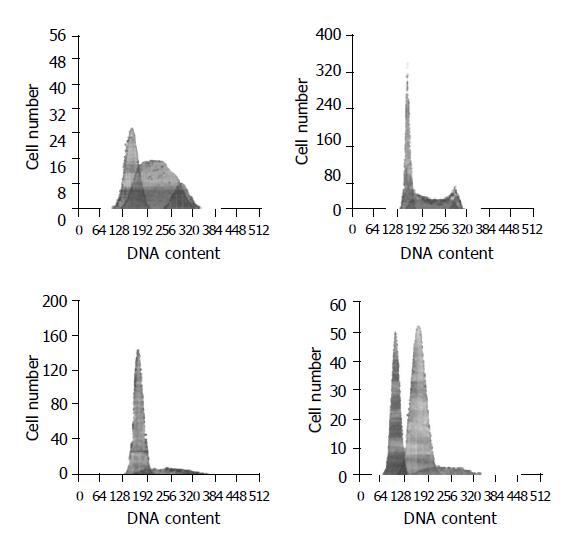
Figure 6 Cell cycle and apoptosis of K562 affected by STI571 and P27 1: Cell cycle of control K562 cells; 2: Cell cycle of K562 cells affected by P27; 3: Cell cycle of K562 cell affected by 0.
25 μmol/L STI571; and 4: Cell cycle and apoptosis of K562 cells affected by STI571 and P27.
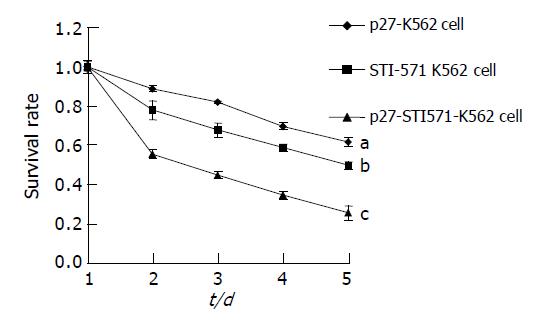
Figure 7 Cell survival rate of K562 cell affected by p27 and STI571.
The presented values were mean±SE, n = 3; aP<0.05 (between groups), bP<0.01 vs p27-k562 cell, and cP<0.05 vs STI571-k562 cell.
- Citation: Wang W, Yao LB, Liu XP, Feng Q, Shang ZC, Cao YX, Sun BZ. Effects of STI571 and p27 gene clone on proliferation and apoptosis of K562 cells. World J Gastroenterol 2005; 11(14): 2130-2135
- URL: https://www.wjgnet.com/1007-9327/full/v11/i14/2130.htm
- DOI: https://dx.doi.org/10.3748/wjg.v11.i14.2130


