Copyright
©2005 Baishideng Publishing Group Inc.
World J Gastroenterol. Mar 28, 2005; 11(12): 1753-1758
Published online Mar 28, 2005. doi: 10.3748/wjg.v11.i12.1753
Published online Mar 28, 2005. doi: 10.3748/wjg.v11.i12.1753
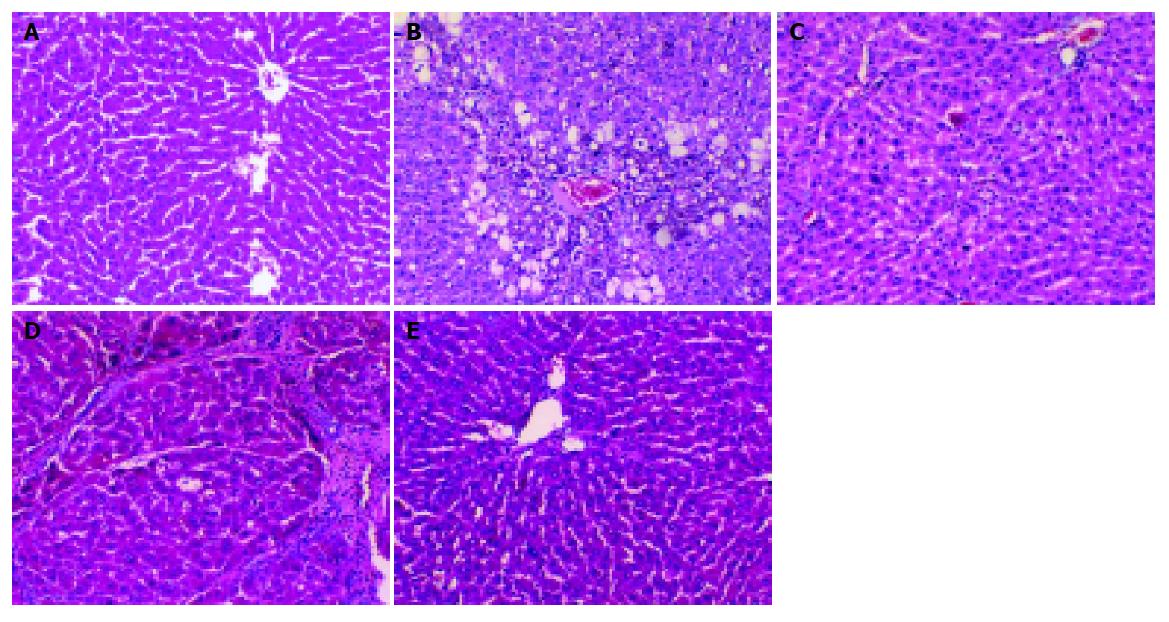
Figure 1 Effect of IL-10 on liver histological change in rats with hepatic fibrosis (HE×100).
A: Rat liver in group N; B: Rat liver in group C in the 7th wk; C: Rat liver in group I in the 7th wk; D: Rat liver in group C in the 11th wk; E: Rat liver in group I in the 11th wk.
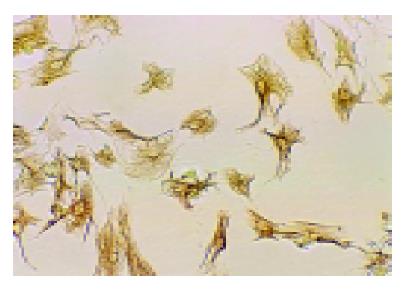
Figure 2 Desmin expression of HSC cultured for five days by immunochemistry (SP×100).
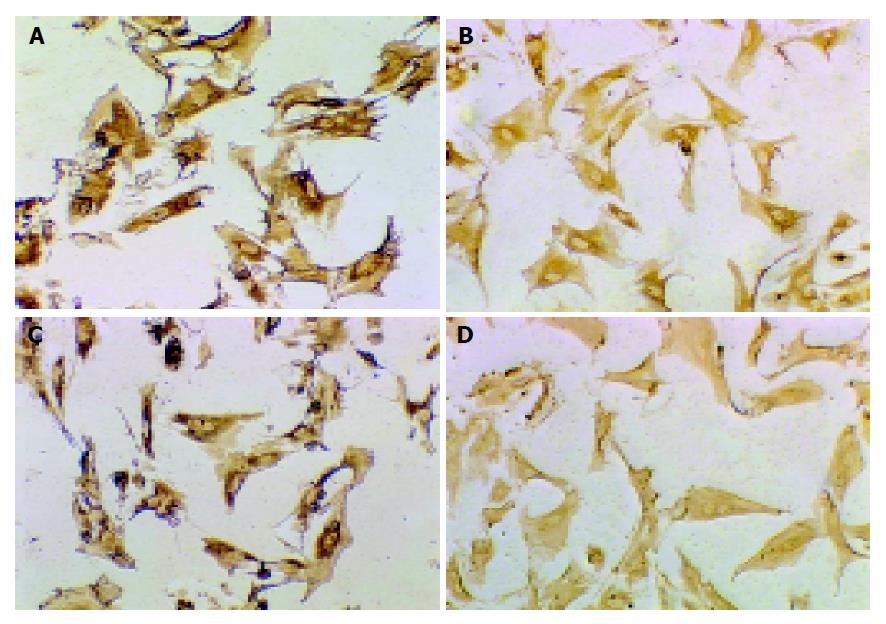
Figure 3 Expression of MMP-2 (A, B) and TIMP-1 (C, D) of HSC in group C and group I during the 7th wk (SP×100).
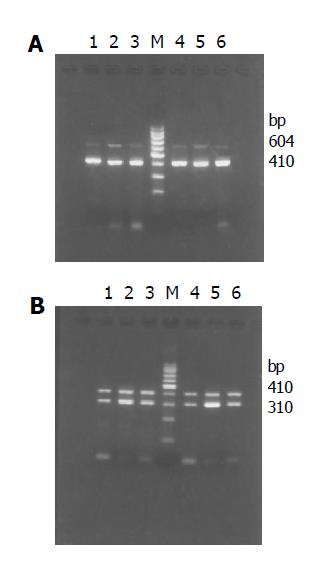
Figure 4 Agarose gel electrophoresis of RT-PCR product of MMP-2 gene (A) and TIMP-1 gene (B).
Lanes 1–3: groups N, C and I in the 7th wk; lanes 4–6: groups N, C and I in the 11th wk; M: 100-bp DNA ladder.
- Citation: Zheng WD, Zhang LJ, Shi MN, Chen ZX, Chen YX, Huang YH, Wang XZ. Expression of matrix metalloproteinase-2 and tissue inhibitor of metalloproteinase-1 in hepatic stellate cells during rat hepatic fibrosis and its intervention by IL-10. World J Gastroenterol 2005; 11(12): 1753-1758
- URL: https://www.wjgnet.com/1007-9327/full/v11/i12/1753.htm
- DOI: https://dx.doi.org/10.3748/wjg.v11.i12.1753


