Copyright
©2005 Baishideng Publishing Group Inc.
World J Gastroenterol. Mar 28, 2005; 11(12): 1742-1746
Published online Mar 28, 2005. doi: 10.3748/wjg.v11.i12.1742
Published online Mar 28, 2005. doi: 10.3748/wjg.v11.i12.1742
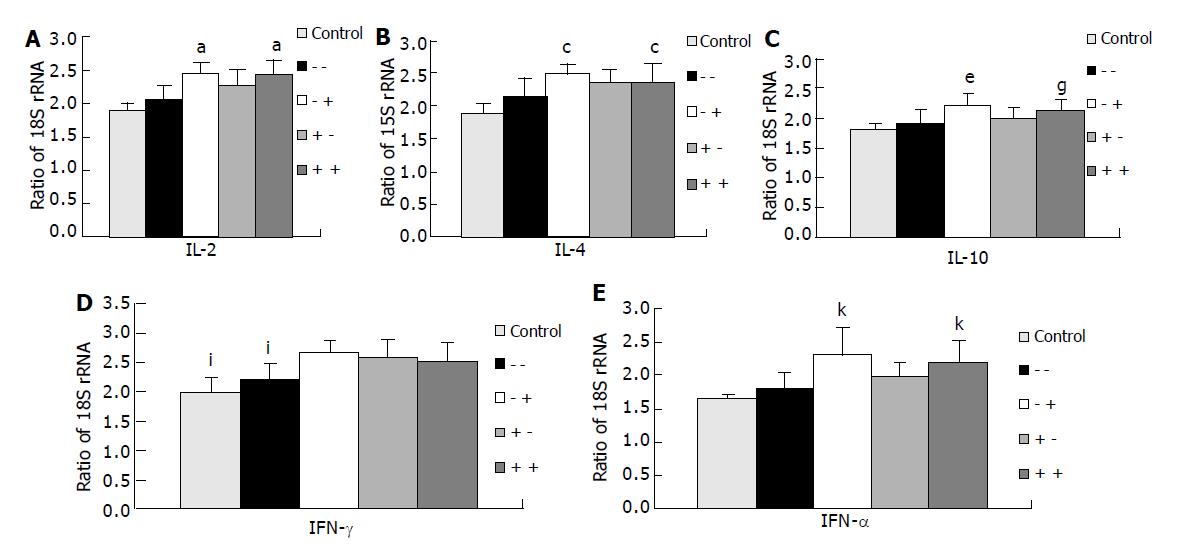
Figure 1 Expression of interleukin (IL)-2, IL-4, IL-10, interferon (IFN)-γ and tumor necrosis factor (TNF)-α messenger RNA in the spleen as determined by RT-PCR (control, n = 9; group 1, n = 11; group 2, n = 9; group 3, n = 9; group 4, n = 11).
A: Expression of IL-2 messenger RNA in the spleen. aP<0.05 vs control group and group 1 (-/-); B: Expression of IL-4 messenger RNA in the spleen. cP<0.05 vs control group and group 1 (-/-); C: Expression of IL-10 messenger RNA in the spleen. eP<0.05 vs control group, group 1 (-/-) and group 3 (+/-); gP<0.05 vs control group and group 1 (-/-); D: Expression of IFN-γ messenger RNA in the spleen. iP<0.05 vs experimental groups 2, 3, 4; E: Expression of TNF-α messenger RNA in the spleen. kP<0.05 vs group 2 (-/+), group 3 (+/-) and group 4 (+/+).
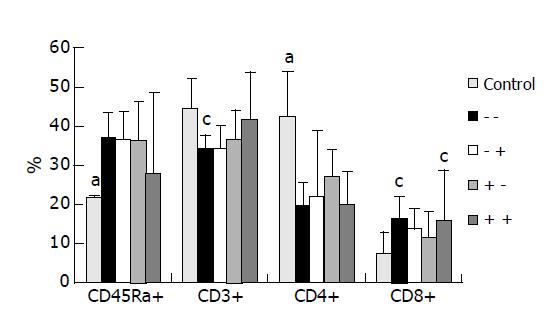
Figure 2 Distributions of CD45Ra+, CD3+, CD4+, and CD8+ in splenocytes from control group and experimental groups 3 d after CLP.
aP<0.05 vs the other groups; cP<0.05 vs control group.
- Citation: Yeh SL, Lai YN, Shang HF, Lin MT, Chiu WC, Chen WJ. Effects of glutamine supplementation on splenocyte cytokine mRNA expression in rats with septic peritonitis. World J Gastroenterol 2005; 11(12): 1742-1746
- URL: https://www.wjgnet.com/1007-9327/full/v11/i12/1742.htm
- DOI: https://dx.doi.org/10.3748/wjg.v11.i12.1742


