Copyright
©2005 Baishideng Publishing Group Inc.
World J Gastroenterol. Mar 21, 2005; 11(11): 1599-1604
Published online Mar 21, 2005. doi: 10.3748/wjg.v11.i11.1599
Published online Mar 21, 2005. doi: 10.3748/wjg.v11.i11.1599
Math 1 Math(A1).
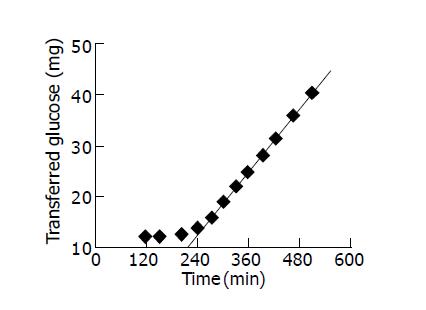
Figure 1 Transferred glucose through the collagen gel membrane vs time in a diffusion experiment (c1 = 10 g/L, t0 = 122 min).
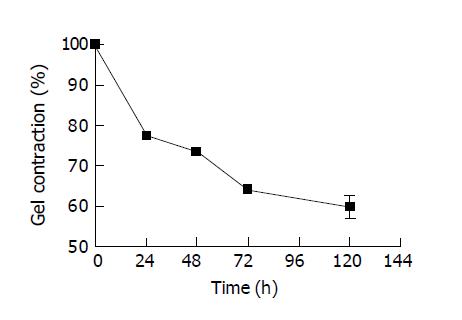
Figure 2 Contraction of cylindrical collagen gels entrapped with hepatocytes.
Gel contraction was expressed as the average percentage of diameter of three cylindrical gels entrapped with hepatocytes to the initial gel diameter vs time.
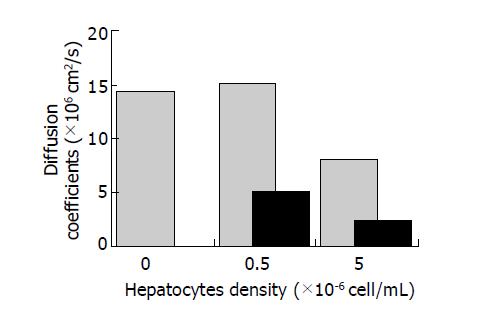
Figure 3 Effective diffusion coefficients of glucose in cell-free collagen gel and gel-cell matrices.
Data from two independent experiments are shown.
Figure 4 Fluorescent microscope images of rat hepatocytes entrapped for 78 h and KB cells entrapped for 72 h stained with FDA/EB.
A: Hepatocytes entrapped in hollow fibers with MWCO of 100 ku; B: Hepatocytes entrapped in hollow fibers with MWCO of 30 ku; C: KB cells entrapped in hollow fibers with MWCO of 100 ku; D: KB cells entrapped in hollow fibers with MWCO of 30 ku.
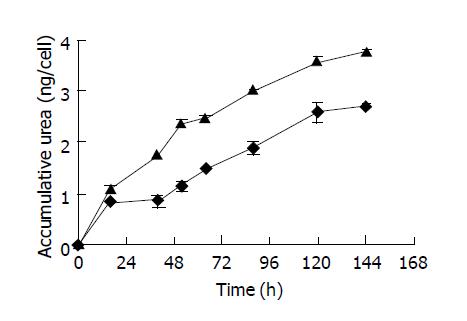
Figure 5 Accumulative urea production of hepatocytes by gel entrapment within hollow fibers featured by microporous membrane with pore size of 0.
1 µm (triangle) and ultrafiltration membrane with MWCO of 100 ku (diamond). Average data from triplicate samples are shown. The error bars express standard deviation.
- Citation: Wu DQ, Zhang GL, Shen C, Zhao Q, Li H, Meng Q. Evaluation of diffusion in gel entrapment cell culture within hollow fibers. World J Gastroenterol 2005; 11(11): 1599-1604
- URL: https://www.wjgnet.com/1007-9327/full/v11/i11/1599.htm
- DOI: https://dx.doi.org/10.3748/wjg.v11.i11.1599


