Copyright
©2005 Baishideng Publishing Group Inc.
World J Gastroenterol. Mar 14, 2005; 11(10): 1503-1507
Published online Mar 14, 2005. doi: 10.3748/wjg.v11.i10.1503
Published online Mar 14, 2005. doi: 10.3748/wjg.v11.i10.1503
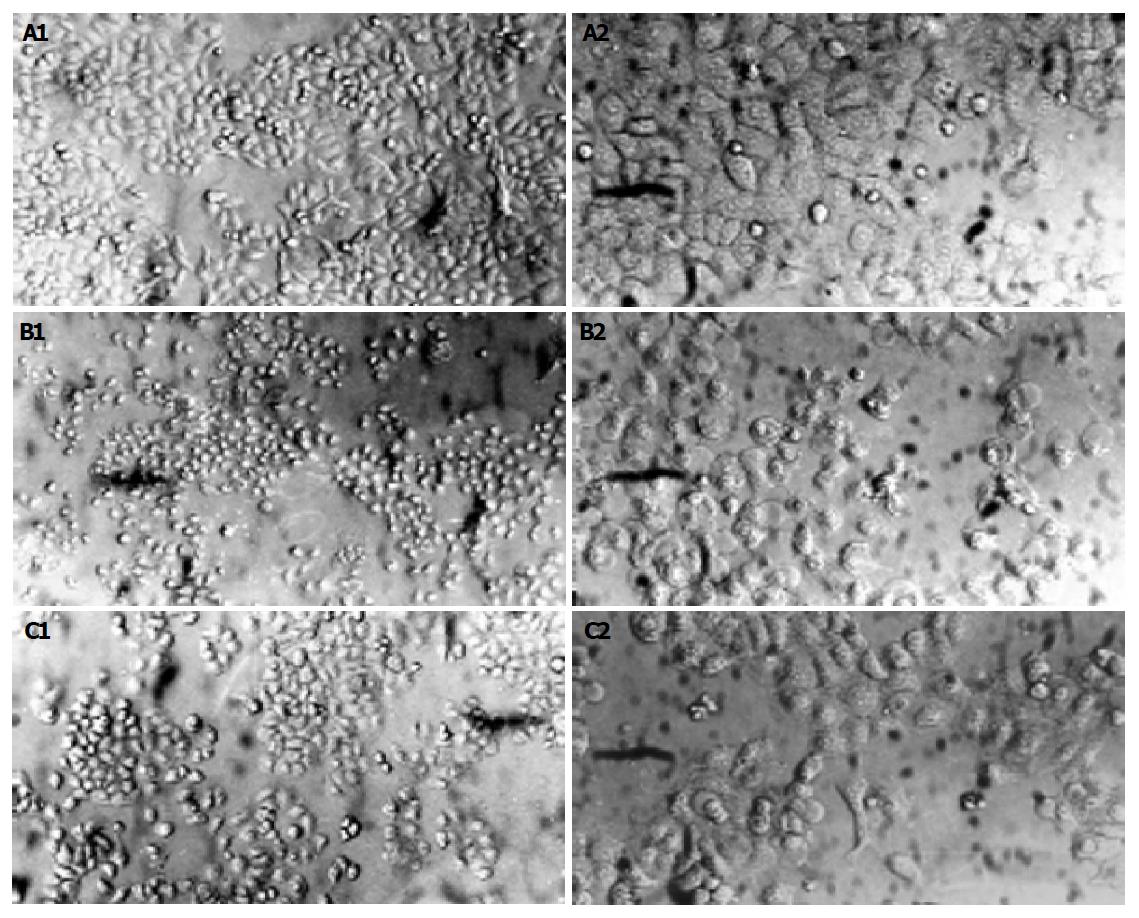
Figure 1 Effect of RTP on cell injury induced by H2O2 after different treatment.
A: Normal; B: H2O2; C: H2O2+RTP. 1: 100×; 2: 200×.
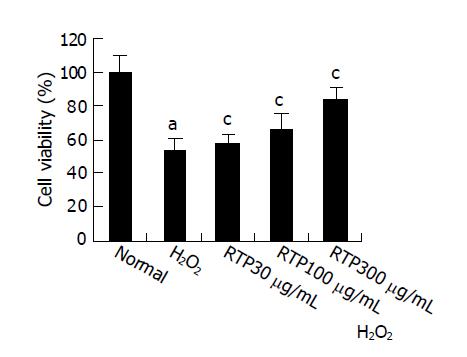
Figure 2 Effect of RTP on cell viability after different treatment.
aP<0.05 vs normal, cP<0.05 vs H2O2.
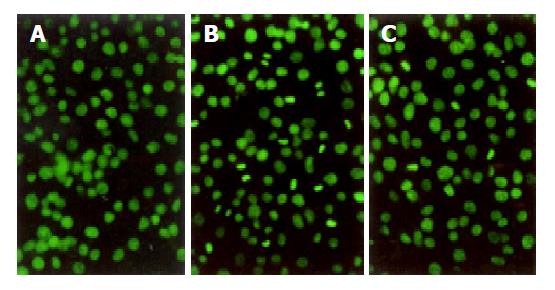
Figure 3 Morphological changes of cell apoptosis detected by acridine orange staining.
A: Normal; B: H202; C: H202+RTP.
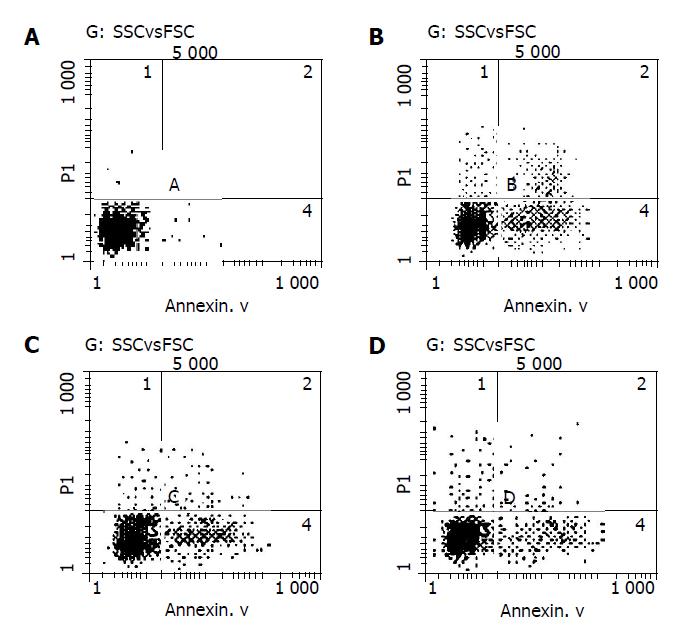
Figure 4 Effect of RTP on cell apoptosis after different treatment detected by flow cytometry.
A: Normal; B: H2O2; C: H2O2+RTP (100 μg/mL); D: H2O2+RTP (300 μg/mL).
Figure 5 Effect of RTP on LDH activity (A), MDA content (B) and SOD activity (C) after different treatment bP<0.
01 vs normal, dP<0.01 vs H2O2.
-
Citation: Liu LN, Mei QB, Liu L, Zhang F, Liu ZG, Wang ZP, Wang RT. Protective effects of
Rheum tanguticum polysaccharide against hydrogen peroxide-induced intestinal epithelial cell injury. World J Gastroenterol 2005; 11(10): 1503-1507 - URL: https://www.wjgnet.com/1007-9327/full/v11/i10/1503.htm
- DOI: https://dx.doi.org/10.3748/wjg.v11.i10.1503


