Copyright
©2005 Baishideng Publishing Group Inc.
World J Gastroenterol. Mar 14, 2005; 11(10): 1452-1456
Published online Mar 14, 2005. doi: 10.3748/wjg.v11.i10.1452
Published online Mar 14, 2005. doi: 10.3748/wjg.v11.i10.1452
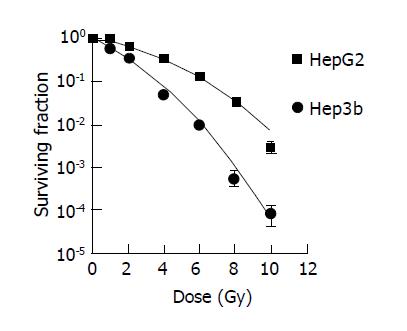
Figure 1 Standard dose-survival curves of HepG2 and Hep3b fitted with standard two parameter LQ model.
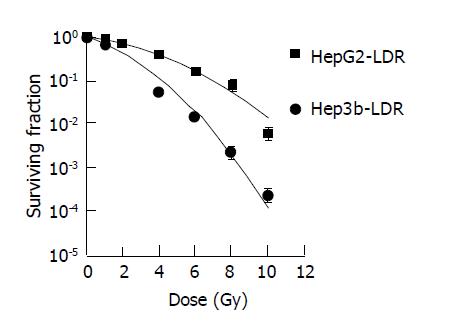
Figure 2 Dose-survival curves of HepG2 and Hep3b irradiated at a low dose rate of 0.
067 Gy/min fitted with incomplete repair model.
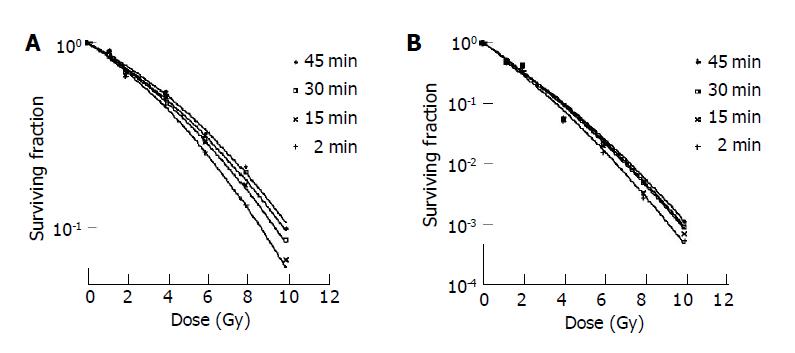
Figure 3 Effects of fractionated irradiation modeling EBRT and IMRT on survival of HepG2 and Hep3b.
A: Cell survival curve of HepG2 fitted with LQ model; B: Cell survival curve of Hep3b fitted with LQ model. Cells were irradiated modeling fractionated EBRT [+] with doses of 0.0Gy, 1Gy×1, 2Gy×1, 2Gy×2, 2Gy×3, 2Gy×4 and 2Gy×5 delivered within a fraction time of 3 min, as well as modeling IMRT with the corresponding doses delivered within a fraction time of [×] 15 min, [□] 30 min or [◆] 45 min.
- Citation: Zheng XK, Chen LH, Yan X, Wang HM. Impact of prolonged fraction dose-delivery time modeling intensity-modulated radiation therapy on hepatocellular carcinoma cell killing. World J Gastroenterol 2005; 11(10): 1452-1456
- URL: https://www.wjgnet.com/1007-9327/full/v11/i10/1452.htm
- DOI: https://dx.doi.org/10.3748/wjg.v11.i10.1452


