Copyright
©2005 Baishideng Publishing Group Inc.
World J Gastroenterol. Jan 7, 2005; 11(1): 17-21
Published online Jan 7, 2005. doi: 10.3748/wjg.v11.i1.17
Published online Jan 7, 2005. doi: 10.3748/wjg.v11.i1.17
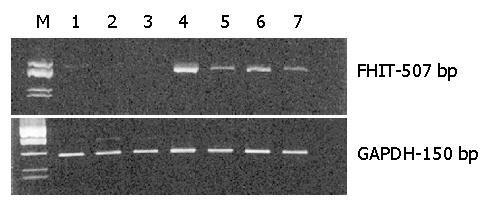
Figure 1 RT-PCR analysis of FHIT and control GAPDH gene expression from the corpus of patients with dyspepsia.
Lanes 1, 2 and 3: patients of group II with a family history of gastric carcinoma and with H pylori infection; lane 4: control patient [(no familial cancer, Hp (-))]; lanes 5, 6 and 7: control patients with Hp (+).
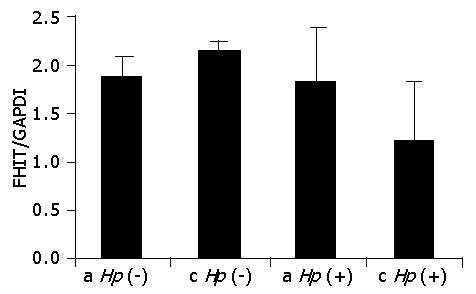
Figure 2 Comparison of FHIT expression in the gastric mucosa of group I patients (without family histories of cancer), with the topography of the biopsied specimens (a, antrum; c, corpus) and H pylori colonization (Hp(+)/Hp(-)).
The mean ± SE values are marked.
Figure 3 Comparison of expression of FHIT gene in the gastric mucosa of group II patients (with family histories of cancer), with the topography of the biopsied specimens and H pylori colonization.
The mean±SE values are marked.
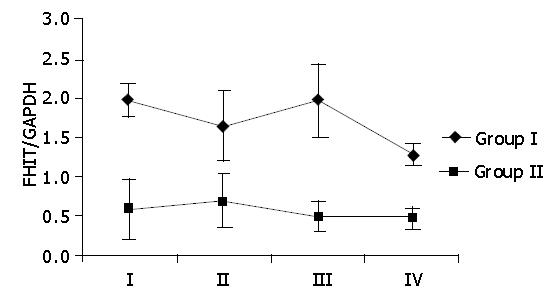
Figure 4 Comparison of the FHIT/GAPDH mean values for the patients of groups I and II and the macroscopic evaluation of the gastric mucosa on the Sydney scale.
The FHIT/GAPDH mean values were calculated for all cases of each Sydney system group, independent of stomach topography and colonization with H pylori. The mean±SE values are marked.
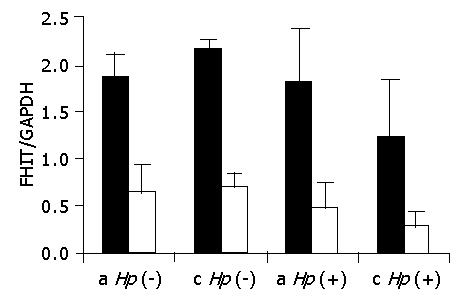
Figure 5 Comparison of expression of FHIT gene in the first (dark bars) and second group (white bars) of patients without and with family histories of cancer, respectively, depending on the topography of biopsied gastric mucosa tissues and H pylori colonization.
-
Citation: Stec-Michalska K, Antoszczyk S, Klupinska G, Nawrot B. Loss of
FHIT expression in gastric mucosa of patients with family histories of gastric cancer andHelicobacter pylori infection. World J Gastroenterol 2005; 11(1): 17-21 - URL: https://www.wjgnet.com/1007-9327/full/v11/i1/17.htm
- DOI: https://dx.doi.org/10.3748/wjg.v11.i1.17


