Copyright
©The Author(s) 2004.
World J Gastroenterol. May 1, 2004; 10(9): 1329-1332
Published online May 1, 2004. doi: 10.3748/wjg.v10.i9.1329
Published online May 1, 2004. doi: 10.3748/wjg.v10.i9.1329
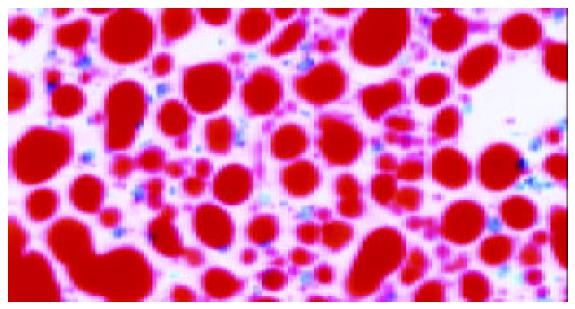
Figure 1 Swelling, diffusive steatosis of hepatocytes (SudanIV 40×).
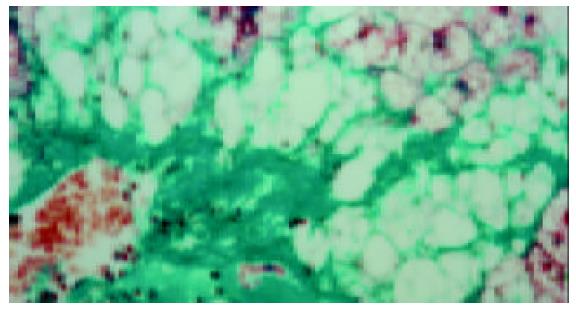
Figure 2 Central vein fibrosis (Masson 40 ×).
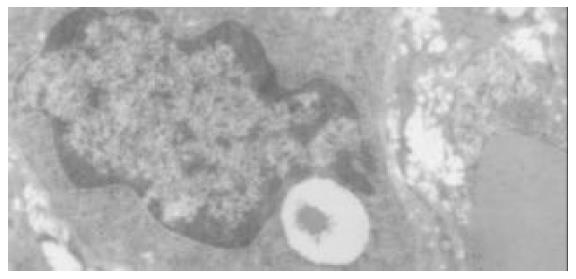
Figure 3 Activated stellate cells and perisinusoid fibrosis (TEM × 8000).
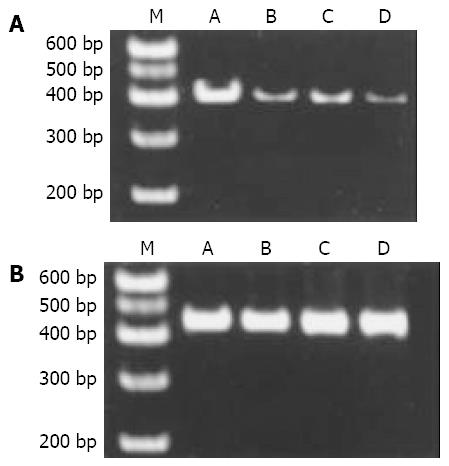
Figure 4 Expression of PPARγ mRNA and GAPDH mRNA in the liver of rats with FLD.
A: Expression of PPARγ mRNA in the liver of rats with FLD; B: Expression of GAPDH mRNA in the liver of rats with FLD. From left to right M: PCR marker; lane A: normal control; lane B: alcohol group; lane C: fat-rich diet group. Lane D: alcohol and fat-rich diet group
- Citation: Zhao CY, Jiang LL, Li L, Deng ZJ, Liang BL, Li JM. Peroxisome proliferator activated receptor-γ in pathogenesis of experimental fatty liver disease. World J Gastroenterol 2004; 10(9): 1329-1332
- URL: https://www.wjgnet.com/1007-9327/full/v10/i9/1329.htm
- DOI: https://dx.doi.org/10.3748/wjg.v10.i9.1329


