Copyright
©The Author(s) 2004.
World J Gastroenterol. May 1, 2004; 10(9): 1315-1320
Published online May 1, 2004. doi: 10.3748/wjg.v10.i9.1315
Published online May 1, 2004. doi: 10.3748/wjg.v10.i9.1315
Figure 1 Histopathological findings of representative liver sections from female rats treated with CCl4.
VG staining, original magnification ×100. A: Control group; B: Ovx+CCl4 group; C: Ovx + CCl4 + β-Est group.
Figure 2 Immunohistochemistry of α-SMA in representative liver sections from female rats treated with CCl4, DAB staining.
A: control group, original magnification ×200; B: Ovx + CCl4 group, original magnification × 400; C: Ovx + CCl4 + β-Est group, original magnification ×400.
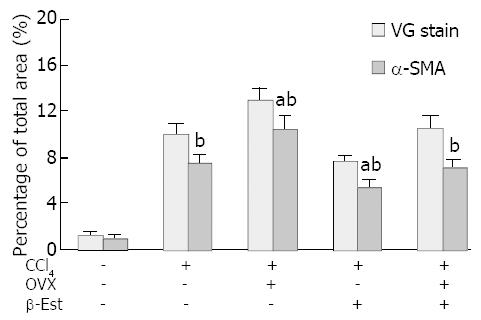
Figure 3 Histopathological and immunohistochemical changes in CCl4-treated female rats (fibrotic area percentage of total field), aP<0.
05 vs CCl4; bP<0.01 vs control.
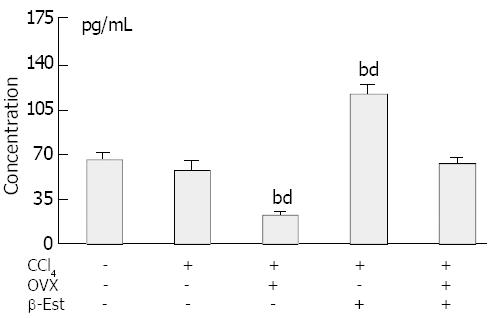
Figure 4 Serum estradiol levels in CCl4–treated female rats, bP<0.
01 vs control, dP<0.01 vs CCl4.
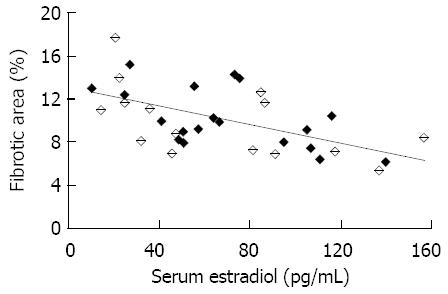
Figure 5 Negative correlation between fibrotic area percentage and serum estradiol level (r = 0.
57, P < 0.01).
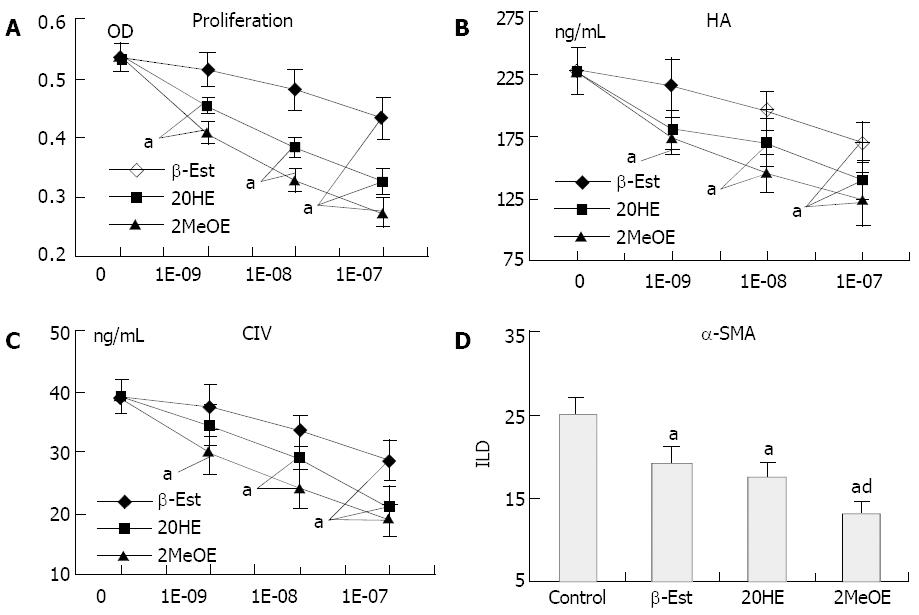
Figure 6 Effects of estradiol metabolites on function of HSCs proliferation (A), HA (B) and C IV (C) secretion in HSCs, effects of 10-7 mol/L estradiol metabolites on α-SMA expression (D) of HSCs.
Values for each point represent mean ± SD from 5 separate experiments, aP < 0.05 vs control, dP < 0.05 vs 10-7 mol/L β-Est.
Figure 7 Representative immunohistochemistry showing expression of ER on HSCs used for studies, original magnification ×200.
No expression of ER-α(A) but ER-β(B) was observed.
- Citation: Liu QH, Li DG, Huang X, Zong CH, Xu QF, Lu HM. Suppressive effects of 17β-estradiol on hepatic fibrosis in CCl4-induced rat model. World J Gastroenterol 2004; 10(9): 1315-1320
- URL: https://www.wjgnet.com/1007-9327/full/v10/i9/1315.htm
- DOI: https://dx.doi.org/10.3748/wjg.v10.i9.1315


