Copyright
©The Author(s) 2004.
World J Gastroenterol. Apr 15, 2004; 10(8): 1198-1203
Published online Apr 15, 2004. doi: 10.3748/wjg.v10.i8.1198
Published online Apr 15, 2004. doi: 10.3748/wjg.v10.i8.1198
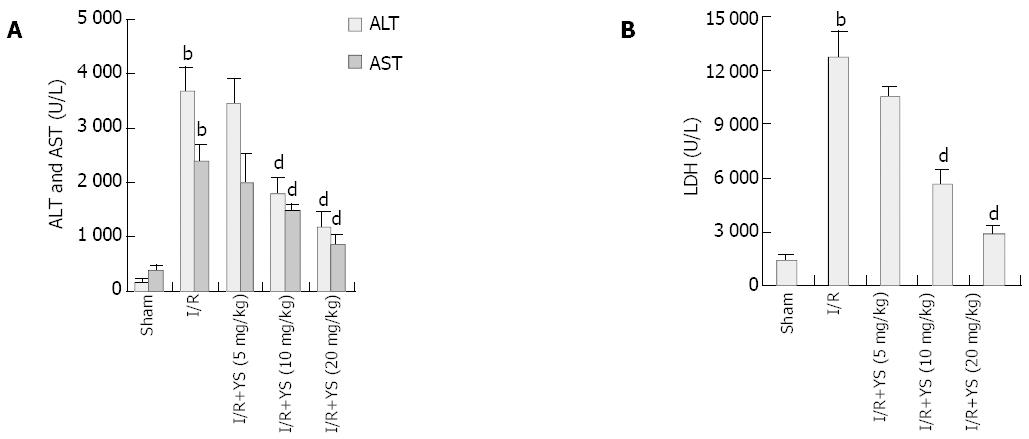
Figure 1 Effects of YS on hepatocellular injury induced by hepatic ischemia and reperfusion.
After 90 min of ischemia and 6 h of reperfusion, serum levels of ALT, AST (A) and LDH (B) were determined. YS at different doses (5, 10, 20 mg/kg) was injected intraperitoneally 24 h and 1 h before ischemia and a third dose was injected intravenously just before reperfusion. For all groups, n = 8. bP < 0.01 compared with sham group; dP < 0.01 compared with I/R group.
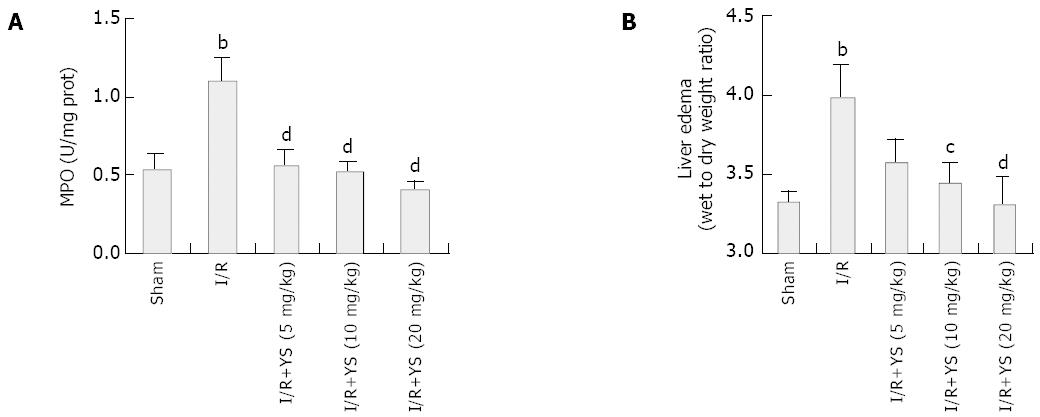
Figure 2 Effects of YS on neutrophil recruitment (A) and liver edema (B) induced by 90 min of ischemia and 6 h of reperfusion.
MPO contents in liver tissues were analyzed as the index of neutrophil recruitment. Liver edema was determined by tissue wet-to-dry weight ratio. YS at different doses (5, 10, 20 mg/kg) was injected intraperitoneally 24 h and 1 h before ischemia and a third dose was injected intravenously just before reperfusion. For all groups, n = 8. bP < 0.01 compared with sham group; cP < 0.05, dP < 0.01 compared with I/R group.
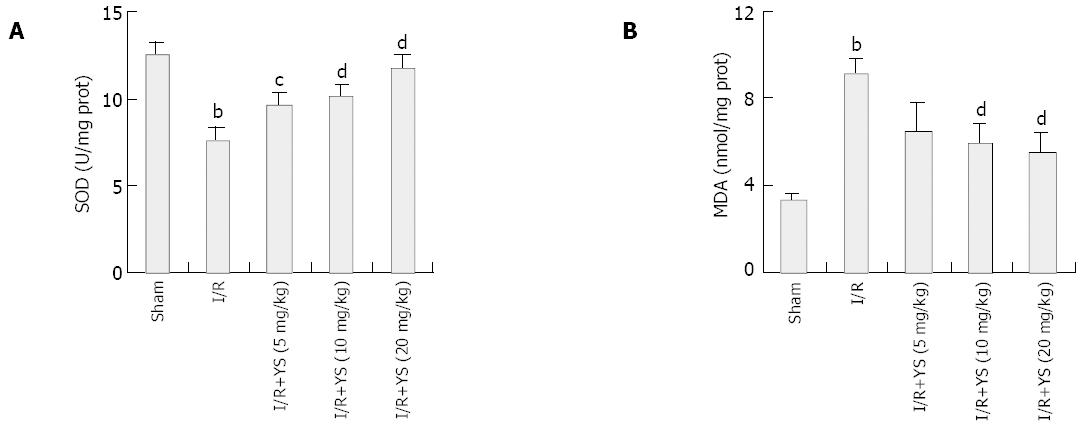
Figure 3 Effects of YS on SOD (A) and MDA (B) levels in liver tissues.
After 90 min of ischemia and 6 h of reperfusion, liver tissues were homogenized and assayed for SOD and MDA levels as the index of hepatic oxidative stress. YS with different dose (5, 10, 20 mg/kg) was injected intraperitoneally 24 h and 1 h before ischemia and a third dose was injected intravenously just before reperfusion. For all groups, n = 8. bP < 0.01 compared with sham group; cP < 0.05, dP < 0.01 compared with I/R group.
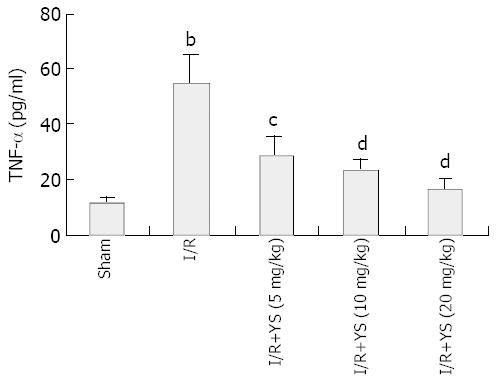
Figure 4 Effects of YS on serum levels of TNF-α analyzed by enzyme-linked immunosorbent assay.
Mice were subjected to 90 min of ischemia and 6 h of reperfusion. Saline or YS with differ-ent dose (5, 10, 20 mg/kg) was injected intraperitoneally 24 h and 1 h before ischemia and a third dose was injected intravenously just before reperfusion. For all groups, n = 8. bP < 0.01 compared with sham group; cP < 0.05, dP < 0.01 compared with I/R group.
Figure 5 Immunohistochemical assay of TNF-α on liver tissue.
Compared with sham control (A), the expression of TNF-α was highly up-regulated by 90 min of ischemia and 6 h of reperfusion (B), and the up-regulation of TNF-α expression was markedly inhibited by YS (20 mg/kg) (C). Original magnification: × 400.
Figure 6 Immunohistochemical assay of ICAM-1 on liver tissue.
Compared with sham control (A), the expression of ICAM-1 was highly up-regulated by 90 min of ischemia and 6 h of reperfusion (B), and the increase of ICAM-1 expression was dramatically inhibited by YS (20 mg/kg) (C). Original magnification: × 400.
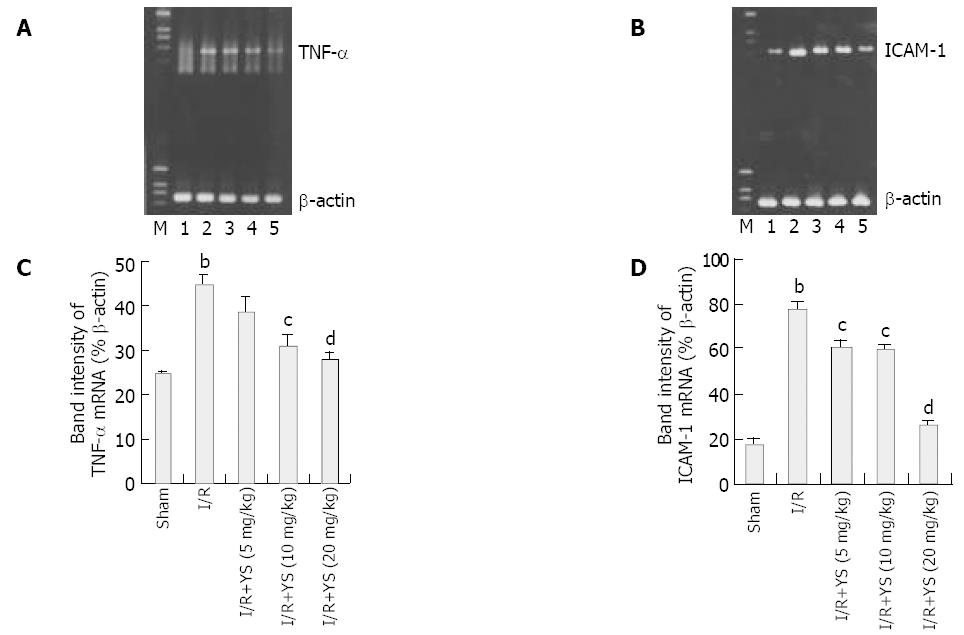
Figure 7 RT-PCR analysis of TNF-α (A) and ICAM-1 (B) mRNA expression in the liver tissues.
β-actin was used as control. Mice were subjected to 90 min of ischemia and 6 h of reperfusion. Saline or YS with different dose (5, 10, 20 mg/kg) was injected intraperitoneally 24 h and 1 h before ischemia and a third dose was injected intravenously just before reperfusion. Liver RNA extracts were analyzed by reverse transcription PCR and stained with SYBR green dye. M: marker; Lain 1: sham control; Lain 2: I/R group; Lain 3-5: 5, 10 and 20 mg/kg of YS treated groups. The band intensities of TNF-α (C) and ICAM-1 (D) in sham, I/R and YS-treated groups were compared. One representative experiment from three performed is shown. bP < 0.01 compared with sham group; cP < 0.05, dP < 0.01 compared with I/R group.
- Citation: Cheng F, Li YP, Cheng JQ, Feng L, Li SF. The protective mechanism of Yisheng Injection against hepatic ischemia reperfusion injury in mice. World J Gastroenterol 2004; 10(8): 1198-1203
- URL: https://www.wjgnet.com/1007-9327/full/v10/i8/1198.htm
- DOI: https://dx.doi.org/10.3748/wjg.v10.i8.1198


