Copyright
©The Author(s) 2004.
World J Gastroenterol. Apr 15, 2004; 10(8): 1183-1190
Published online Apr 15, 2004. doi: 10.3748/wjg.v10.i8.1183
Published online Apr 15, 2004. doi: 10.3748/wjg.v10.i8.1183
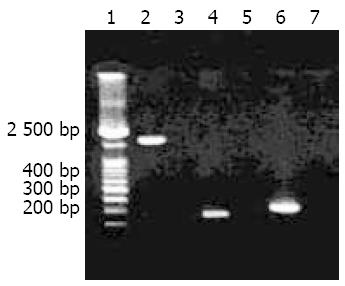
Figure 1 Target amplification fragments of cagA gene amplified from H pylori isolates with different primers.
Lane 1: 100 bp DNA marker; Lanes 2, 4 and 6: Target amplification fragments by using cagA1, F1/B1 and D008/R008 primers, respectively; Lanes 3, 5 and 7: Blank controls.
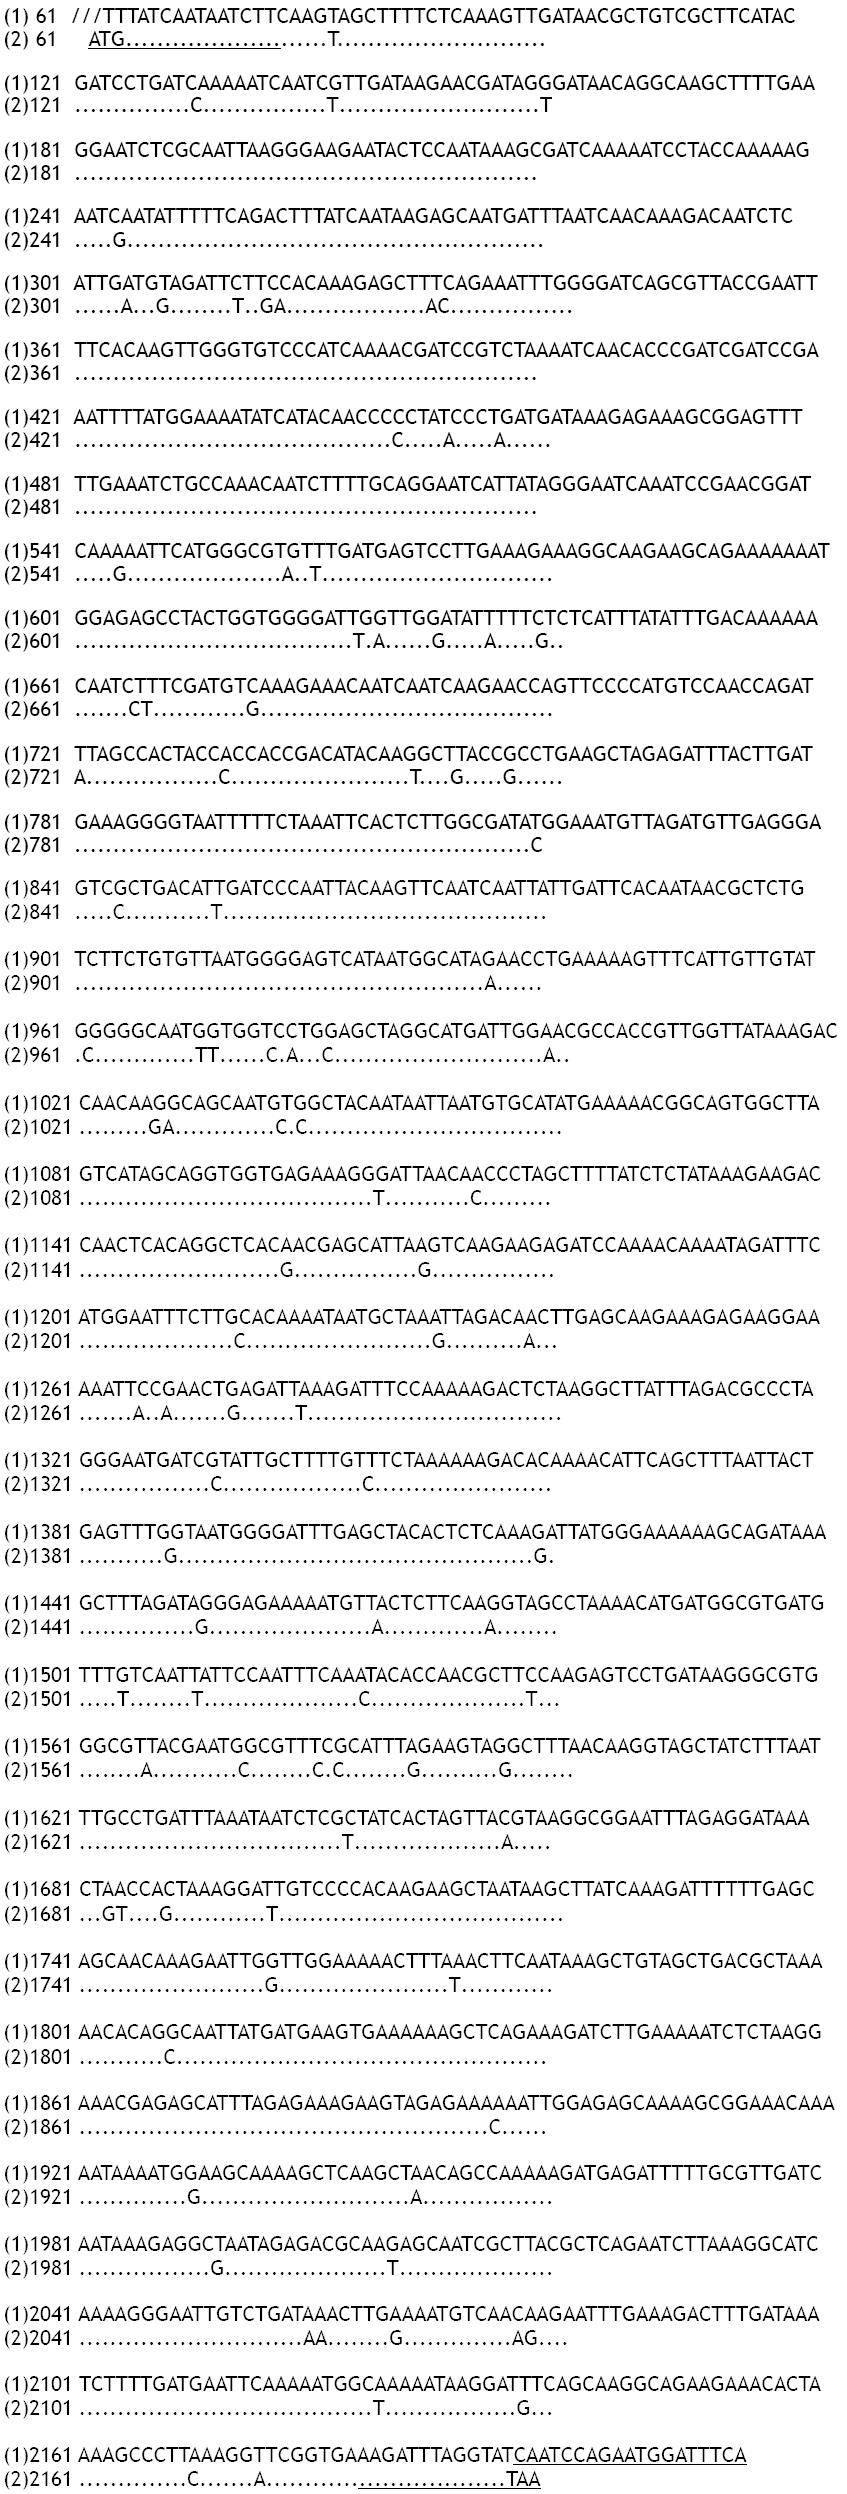
Figure 2 Comparison of nucleotide sequence homology of cagA1 fragments between different H pylori strains.
(1): Corresponding nucleotide sequence of cagA1 fragment from H pylori strain NCTC11637. (2): Sequencing result of cagA1 fragment from H pylori strain Y06. “///” indicates the deletion mutation of the nucleotide residuals. Underlined is the position of the primers.
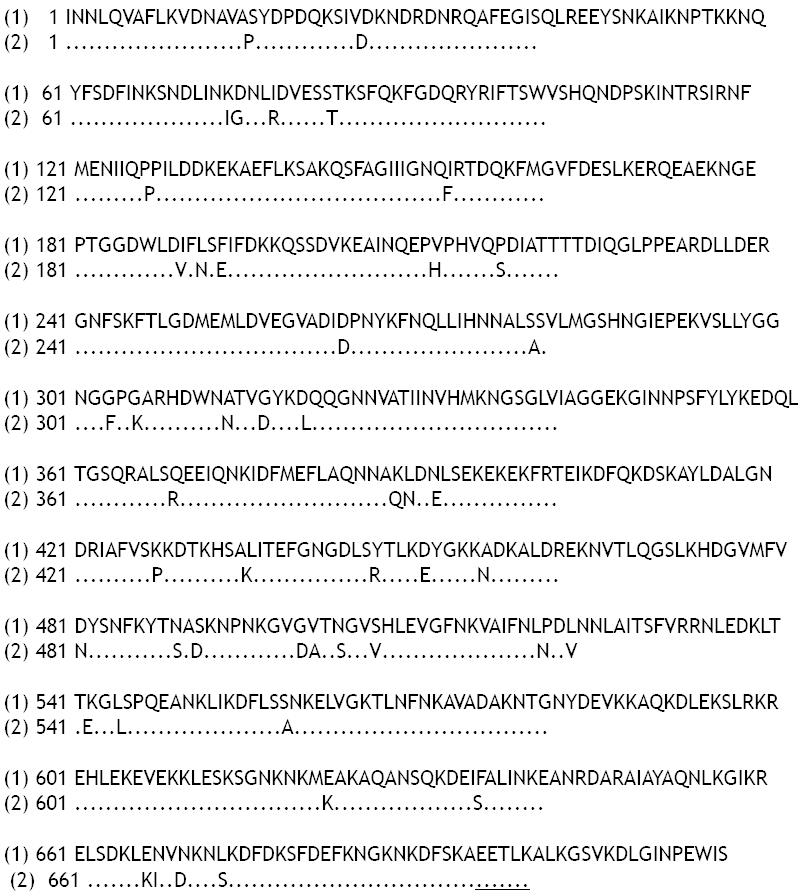
Figure 3 Comparison of putative amino acid sequence homology of cagA1 fragment between different H pylori strains.
(1): Corre-sponding putative amino acid sequence of cagA1 fragment from H pylori strain NCTC11637. (2): Putative amino acid sequence of cagA1 fragment from H pylori strain Y06. Underlined is the position of the primers.
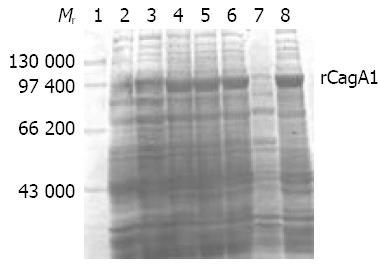
Figure 4 rCagA1 expression by pET32a-cagA1-E.
coli BL21DE3 induced with IPTG. Lane 1: Protein marker; Lane 2: Blank control; Lane 3: Non-induced; Lanes 4-6: induced with 0.1, 0.5 and 1.0 mmol/L IPTG, respectively; Lanes 7 and 8: Bacterial supernatant and precipitate induced with 0.5 mmol/L IPTG, respectively.
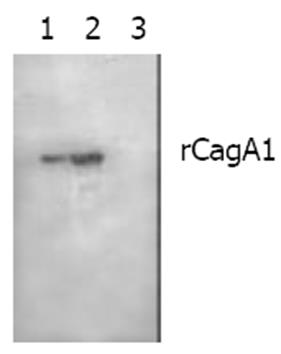
Figure 5 Western blotting of binding between rCagA1 and commercial rabbit antiserum against whole-cell H pylori.
Lanes 1 and 2: 20 μL and 40 μL of rCagA1 extract, respectively; Lane 3: Blank control.
-
Citation: Yan J, Wang Y, Shao SH, Mao YF, Li HW, Luo YH. Construction of prokaryotic expression system of 2 148-bp fragment from
cagA gene and detection ofcagA gene, CagA protein inHelicobacter pylori isolates and its antibody in sera of patients. World J Gastroenterol 2004; 10(8): 1183-1190 - URL: https://www.wjgnet.com/1007-9327/full/v10/i8/1183.htm
- DOI: https://dx.doi.org/10.3748/wjg.v10.i8.1183


