Copyright
©The Author(s) 2004.
World J Gastroenterol. Apr 15, 2004; 10(8): 1162-1166
Published online Apr 15, 2004. doi: 10.3748/wjg.v10.i8.1162
Published online Apr 15, 2004. doi: 10.3748/wjg.v10.i8.1162
Figure 1 A: Scanning electron micrographs of DC, B: Scanning electron micrographs of SW480 cell, C: Scanning electron micro-graphs of larg nonadherent cell, possibly a DC/SW480 fusion cell after treatment with 50%PEG.
Figure 2 A: Fluorescent green staining of dendritic cells from peripheral blood mononuclear cells of patients using PKH67-GL.
B: Fluorescent red staining of colon cancer cells SW480 using PKH26-GL. C: Fusion between PKH stained dendritic cells and tumor cells treated with PEG.
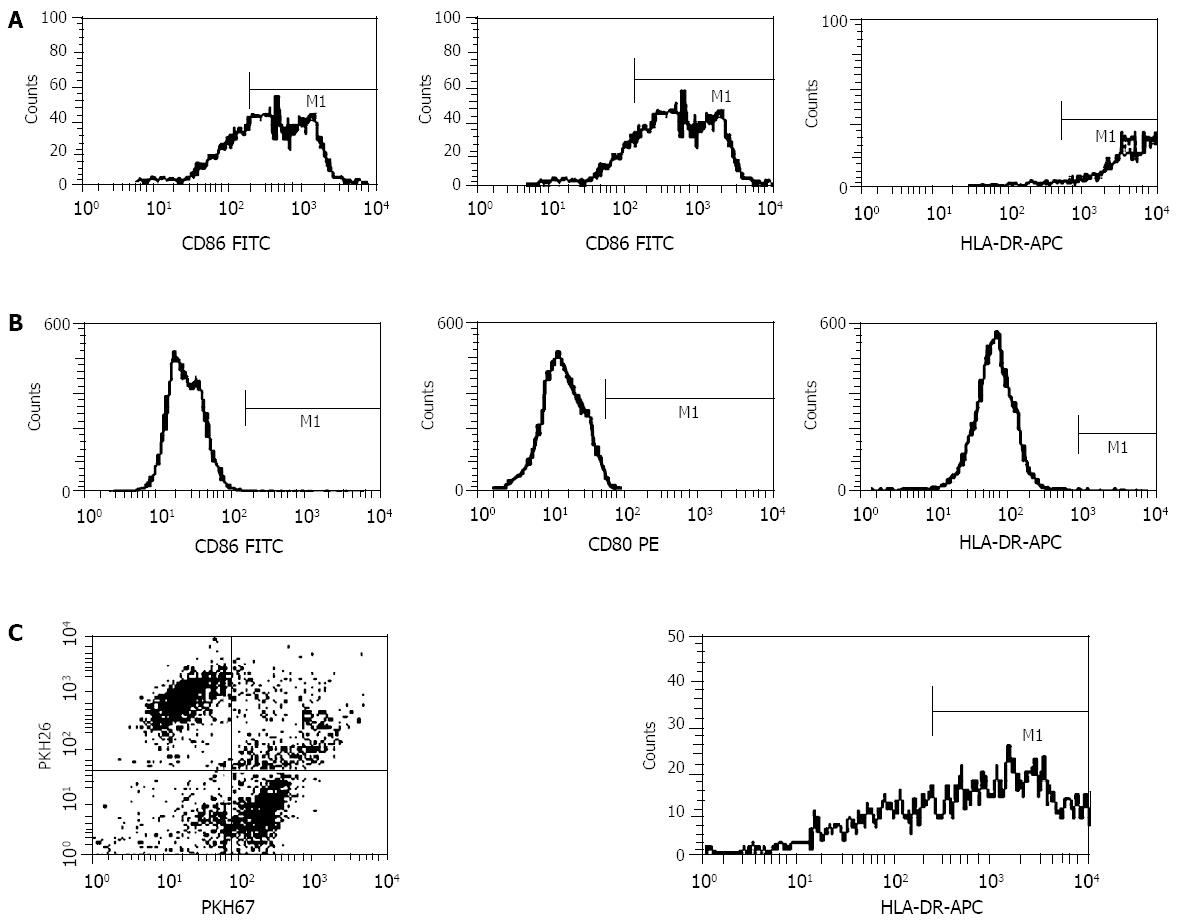
Figure 3 A: High expression of CD86, CD80 and HLA-DR by Dendritic cells, B: No expression of CD 86, CD80 and HLA-DR by SW480 cells, C: High expression of major molecule HLA-DR of DCs by dendritomas gated by dual red and fluorescent cells.
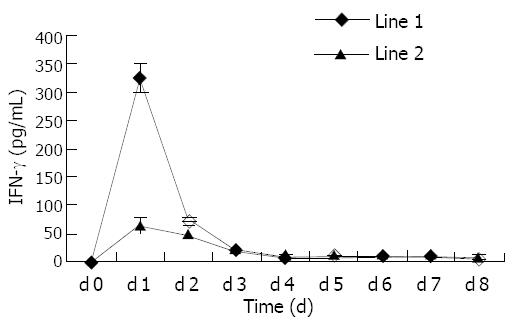
Figure 4 Interferon-γ expression by CTLs.
Lane 1 represents IFN-γ expression by CD8+ T cells primed with dendritomas. Lane 2 represents IFN-γ expression by CD8+ T cells primed with DCs.
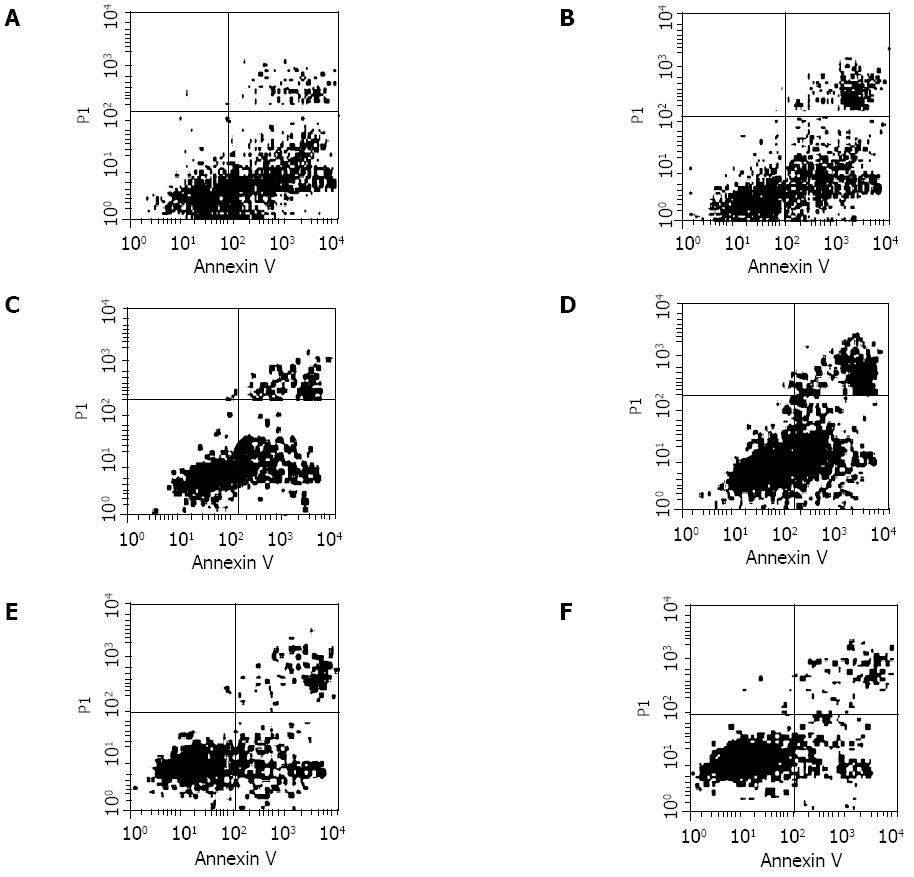
Figure 5 Early apoptosis (single Annexin V positive) of tumor cells measured by flow cytometry.
The apoptotic ratios of SW480 cells affected by CTL induced dendritomas or physical mixture of SW480 cells and DCs without PEG, were about 38.25%(A) and 32.36% respectively (B). The apoptotic ratios of SK-BR-3 cells affected by CTL same as that in SW480, were about 25.64% (C) and 17.43%(D) respectively. The apoptotic ratios in SK-OV-3 were about 21.68% (E) and 17.43%(F).
-
Citation: Xu F, Ye YJ, Wang S.
In vitro antitumor immune response induced by fusion of dendritic cells and colon cancer cells. World J Gastroenterol 2004; 10(8): 1162-1166 - URL: https://www.wjgnet.com/1007-9327/full/v10/i8/1162.htm
- DOI: https://dx.doi.org/10.3748/wjg.v10.i8.1162


