Copyright
©The Author(s) 2004.
World J Gastroenterol. Apr 15, 2004; 10(8): 1132-1136
Published online Apr 15, 2004. doi: 10.3748/wjg.v10.i8.1132
Published online Apr 15, 2004. doi: 10.3748/wjg.v10.i8.1132
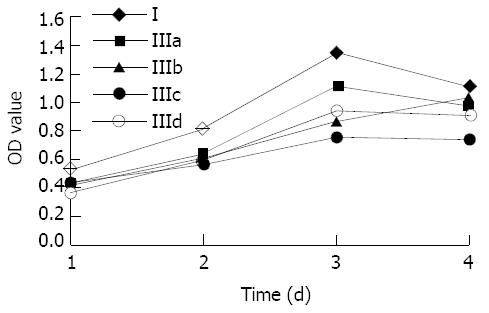
Figure 1 BGC823 cell growth curve.
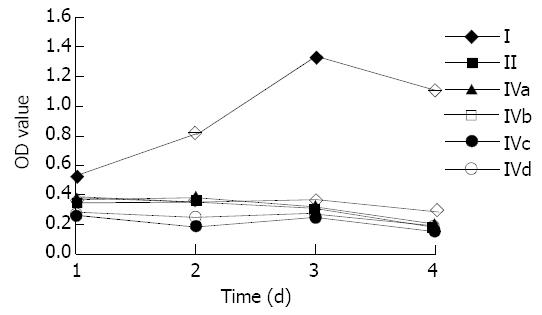
Figure 2 BGC823 cell growth curve.
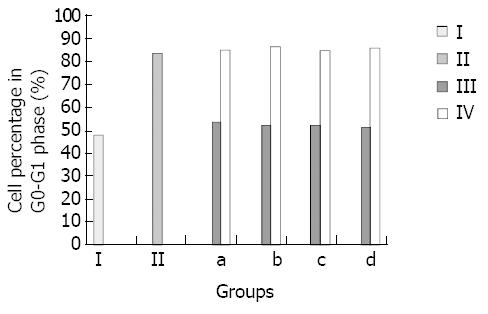
Figure 3 Percentages of cells in G0-G1 phase (%).
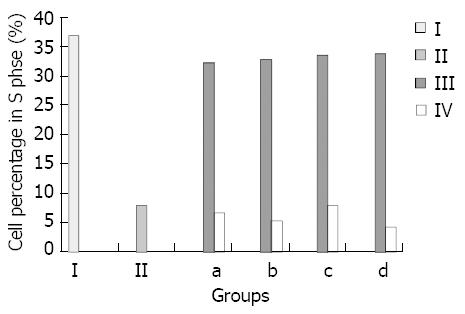
Figure 4 Percentage of cells in S phase (%).
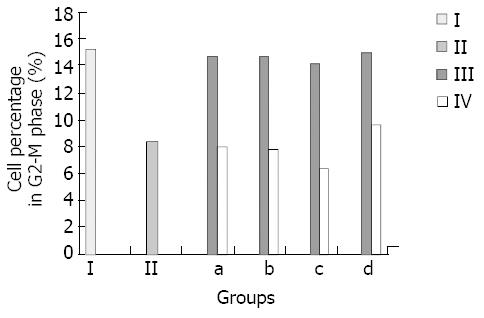
Figure 5 Percentage of cell in G2-M phase (%).
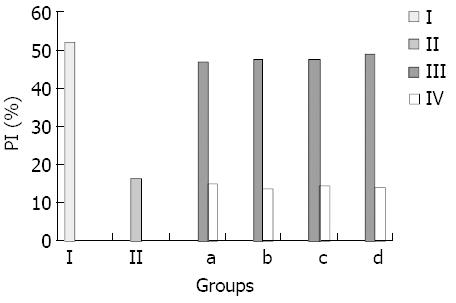
Figure 6 Cell PI (%).
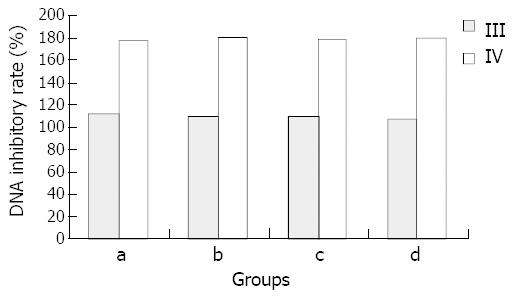
Figure 7 DNA inhibitory rate.
-
Citation: Chen JY, Liang DM, Gan P, Zhang Y, Lin J.
In vitro effects of recombinant human growth hormone on growth of human gastric cancer cell line BGC823 cells. World J Gastroenterol 2004; 10(8): 1132-1136 - URL: https://www.wjgnet.com/1007-9327/full/v10/i8/1132.htm
- DOI: https://dx.doi.org/10.3748/wjg.v10.i8.1132


