Copyright
©The Author(s) 2004.
World J Gastroenterol. Apr 1, 2004; 10(7): 959-964
Published online Apr 1, 2004. doi: 10.3748/wjg.v10.i7.959
Published online Apr 1, 2004. doi: 10.3748/wjg.v10.i7.959
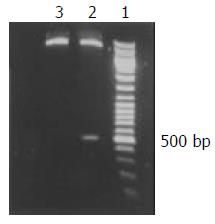
Figure 1 The reconstituted plasmid pcDNA3-X confirmed by restriction endonucleases digestion.
Lane 1: 1 Kb DNA ladder; Lane 2: digestion product of pcDNA3-X; Lane 3: digestion prod-uct of pcDNA3.
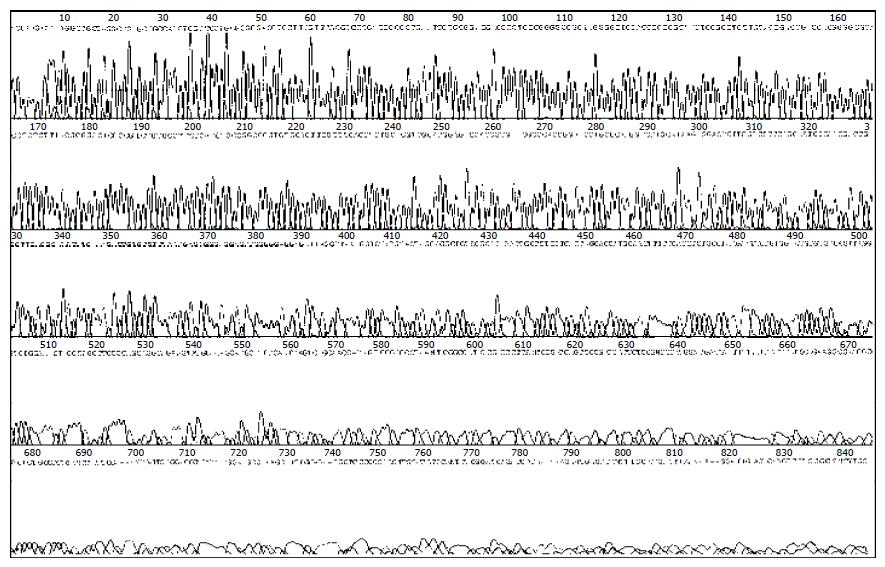
Figure 2 The direct sequencing result of pcDNA3-X (HBV X gene was inserted from 10th bp to 474th bp).
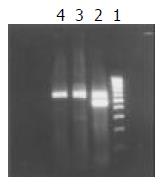
Figure 3 Detection of HBV X gene expression in transfected HL-7702 cells by RT-PCR.
1: 100 bp DNA ladder; 2: HL-7702/HBx cells; 3: HL-7702/PcDNA3 cells; 4: HL-7702 cells.
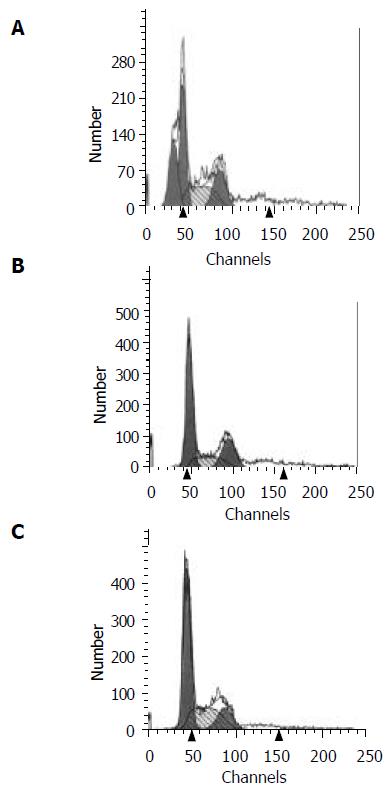
Figure 4 Flow cytometric analysis of apoptosis of HL-7702 cells.
A: HL-7702/HBx cells; B: HL-7702/pcDNA3 cells; C: HL-7702 cells.
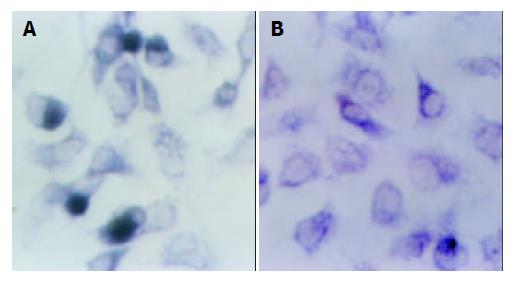
Figure 5 TUNEL analysis of apoptosis of HL-7702 cells.
A: HL-7702/HBx cells ( × 400). The cells showing blue-dark nuclear staining were apoptotic cells. B: HL-7702/PcDNA3 cells ( × 400), no apoptotic cells were seen.
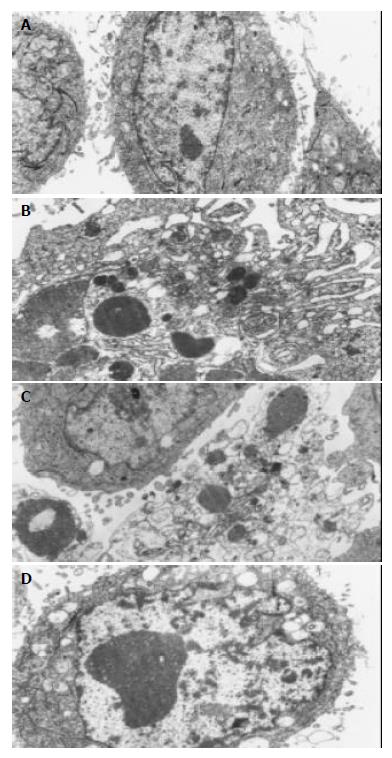
Figure 6 Cell apoptosis observed under electronic microscope.
A: HL-7702/pcDNA3 cells ( × 4800). B: Typical apoptosis were found in HL-7702/HBx cells ( × 6000). C: apoptotic body was found in HL-7702/HBx cells (× 4800). D: assemblage of hetero-chromatin and edema of mitochondria were found in HL-7702/ HBx cells ( × 4800).
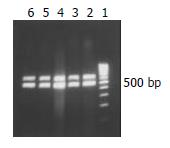
Figure 7 Semi-quantitative analysis of instantaneous expres-sion of X gene by RT-PCR.
Lane 1: 100 bp ladder; Lane 2: 24 h after transfection; Lane 3: 48 h after transfection; Lane 4: 72 h after transfection; Lane 5: 96 h after transfection; Lane 6: 120 h after transfection.
Figure 8 Flow cytometric analysis of apoptosis of HL-7702 after transient transfected with HBV X gene.
A: 24 h after transfec-tion (the apoptosis rate is 7.17%); B: 48 h after transfection (the apoptosis rate is 7.40%); C: 72 h after transfection (the apoptosis rate is 14.13%); D: 96 h after transfection (the apoptosis rate is 12.77%); E: 120 h after transfection (the apoptosis rate is 12.11%).
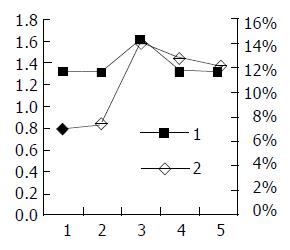
Figure 9 A two-axis broken line graph.
The abscissa repre-sents the days after transfection, and the two axis of ordinate are the relative figure of X gene expression and apoptosis rate: 1: X gene expression; 2: apoptosis rate.
- Citation: Chen HY, Tang NH, Li XJ, Zhang SJ, Chen ZX, Wang XZ. Transfection and expression of hepatitis B virus x gene and its effect on apoptosis in HL-7702 cells. World J Gastroenterol 2004; 10(7): 959-964
- URL: https://www.wjgnet.com/1007-9327/full/v10/i7/959.htm
- DOI: https://dx.doi.org/10.3748/wjg.v10.i7.959


