Copyright
©The Author(s) 2004.
World J Gastroenterol. Mar 15, 2004; 10(6): 864-870
Published online Mar 15, 2004. doi: 10.3748/wjg.v10.i6.864
Published online Mar 15, 2004. doi: 10.3748/wjg.v10.i6.864
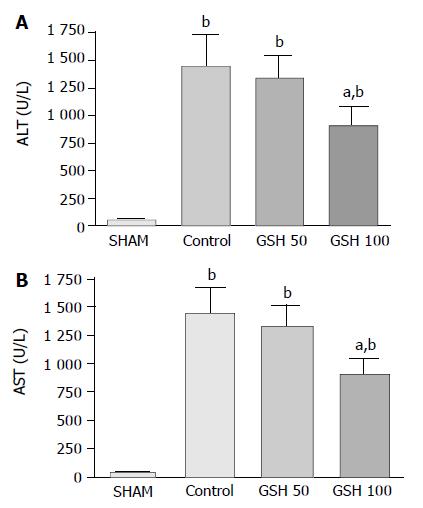
Figure 1 ALT (A) and AST (B) plasma levels after liver transplantation.
Livers preserved for 24 h in UW solution at +4 °C before transplantation. Compared to untreated livers (n = 8) administration of 100 µmol GSH/(h·kg) (n = 5), but not of 50 µmol GSH/(h·kg) (n = 5), resulted in a significant decrease of plasma ALT and AST levels at 2 h of reperfusion. Results are mean ± SE. bP < 0.001 vs sham- operated animals (n = 5); aP < 0.05 vs untreated livers.
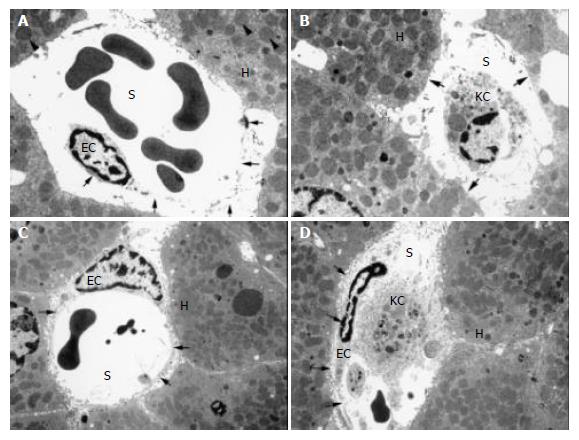
Figure 2 Transmission electron microphotographs of untreated and GSH- treated liver allografts.
Arrow-heads indicate mito-chondrial swelling of hepatocytes in untreated livers (A) which was almost absent in allografts treated with 100 µmol GSH/(h·kg) during reperfusion (C). Arrows demonstrate the loss of hepatocyte microvilli in untreated controls (B) whereas GSH administra-tion preserved microvilli in nearly all hepatocyte membranes (D). As indicated by open arrows detachment of SEC (A) as well as its complete loss (B) was evident in untreated livers. GSH- treatment preserved sinusoidal endothelial lining with a normal space of Dissé (C,D). Letters indicate: H, hepatocyte; KC, Kupffer cell; EC, endothelial cell; S, sinusoidal lumen. Bars represent either 1.7 µm (B) or 2.5 µm (A,C,D).
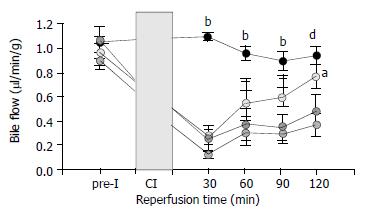
Figure 3 Effect of GSH treatment on bile flow after liver transplantation.
Animals were treated with 50 µmol/(h·kg) GSH (○, n = 5) or 100 µmol/(h·kg) GSH (◎, n = 5) and compared with untreated controls (⊙, n = 8) and a sham- operated group (●, n = 5). Results are mean ± SE. bP < 0.001 vs untreated or GSH-treated livers; dP < 0.01 vs 100 µmol GSH/(h·kg); aP < 0.05 vs un-treated controls.
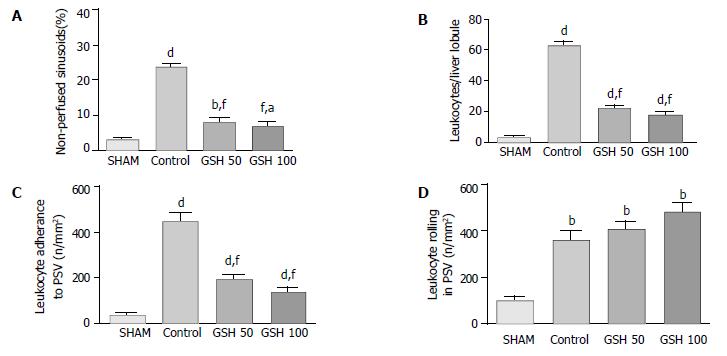
Figure 4 Impact of GSH treatment on the hepatic microcirculation after liver transplantation.
Data from in vivo microscopy were obtained 30 min after starting reperfusion comparing untreated controls (n = 8) with GSH- treated allografts (50 µmol/(h·kg) and 100 µmol/(h·kg); each n = 5) as well as to a sham group (n = 5). (A) Acinar perfusion failure is indicated as the percentage of non-perfused sinusoids (no reflow). (B) Leukocyte-adhesion (sticking) to sinusoids and (C) to postsinusoidal venules. (D) Temporary attachment of leukocytes (rolling) to the endothelium of postsinusoidal venules (PSV). Results are mean ± SE. aP < 0.05, dP < 0.01 and bP < 0.001 vs sham group. fP < 0.001 vs control group.
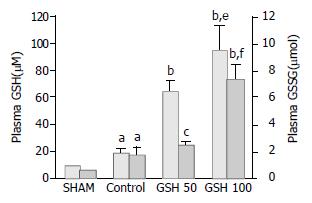
Figure 5 Plasma GSH- and GSSG concentrations following liver transplantation.
Compared to sham-operated animals (n = 5) a significant increase of reduced and oxidized glutathione was determined upon reperfusion of untreated grafts (n = 8). Intravenous infusion of GSH at rates of 50 µmol/(h·kg) (n = 5) and 100 µmol/(h·kg) (n = 5) resulted in a dose- dependent in-crease of plasma GSH concentrations. The corresponding GSSG levels showed only a slight increase after administration of 50 µmol GSH/(h·kg), but increased markedly following infusion of 100 µmol GSH/(h·kg). Mean ± SE. aP < 0.05 vs sham; bP < 0.001 and cP < 0.05 vs control group; eP < 0.05 vs GSH 50 and fP < 0.01 vs GSH 50.
- Citation: Schauer RJ, Kalmuk S, Gerbes AL, Leiderer R, Meissner H, Schildberg FW, Messmer K, Bilzer M. Intravenous administration of glutathione protects parenchymal and non-parenchymal liver cells against reperfusion injury following rat liver transplantation. World J Gastroenterol 2004; 10(6): 864-870
- URL: https://www.wjgnet.com/1007-9327/full/v10/i6/864.htm
- DOI: https://dx.doi.org/10.3748/wjg.v10.i6.864


