Copyright
©The Author(s) 2004.
World J Gastroenterol. Mar 15, 2004; 10(6): 841-846
Published online Mar 15, 2004. doi: 10.3748/wjg.v10.i6.841
Published online Mar 15, 2004. doi: 10.3748/wjg.v10.i6.841
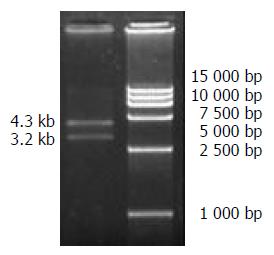
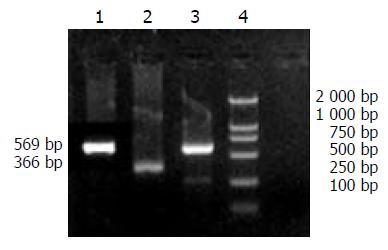
Figure 1 Enzymatic digestion of pBR322-2HBV by EcoRI.
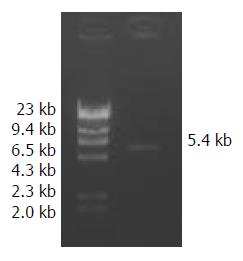
Figure 2 Enzymatic digestion of pcDNA3 by EcoRI.
.
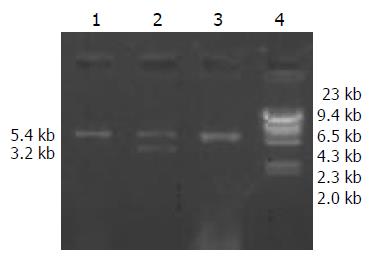
Figure 3 Analysis of ligation of HBV and pcDNA3.
1, 3: pcDNA3 vector, 2: pcDNA3-HBV (5.4 kb + 3.2 kb), 4: DNA marker (λDNA/HindIII).
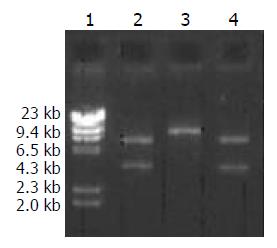
Figure 4 Digestive identification of recombinant plasmid pcDNA3-HBV.
1: DNA marker (λDNA/HindIII), 2: XhoI di-gestion(3.1 kb + 5.5 kb), 3: Hind III digestion (8.6 kb), 4: EcoRI digestion (5.4 kb + 3.2 kb).
Figure 5 Expression of preS1 mRNA by RT-PCR.
1: HepG2.2.15 (positive control); 2: β-actin; 3: HepG2.02G; 4: DNA marker (DL2 000); 5: HepG2 (negative control).
Figure 6 Liver structure of mice by HE-staining (× 200).
A: Liver structure of mice in blank control group, B: Liver structure of mice in negative control group.
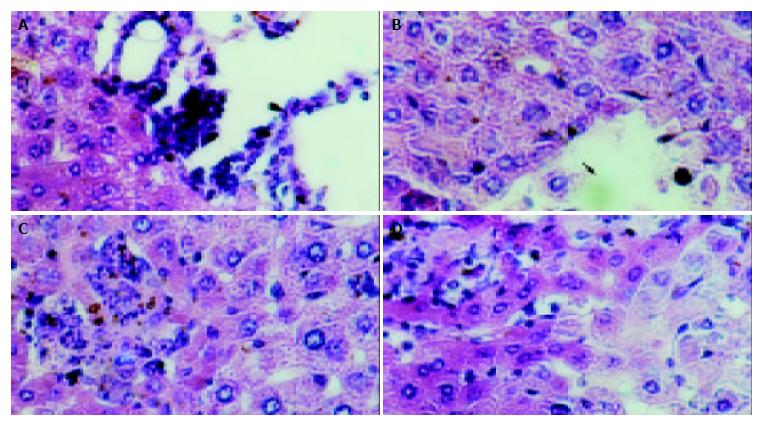
Figure 7 Pathological changes of mouse liver with acute hepatitis in model group(HE, ×200).
A: Infiltration of inflammationary cells in the portal area, B: Local necrosis as arrow indicated, C: Obvious infiltration of inflammatory cells and eosinophilic changes, D: Cytoplasmic loosening of liver cells.
- Citation: Gao LF, Sun WS, Ma CH, Liu SX, Wang XY, Zhang LN, Cao YL, Zhu FL, Liu YG. Establishment of mice model with human viral hepatitis B. World J Gastroenterol 2004; 10(6): 841-846
- URL: https://www.wjgnet.com/1007-9327/full/v10/i6/841.htm
- DOI: https://dx.doi.org/10.3748/wjg.v10.i6.841


