Copyright
©The Author(s) 2004.
World J Gastroenterol. Feb 15, 2004; 10(4): 567-572
Published online Feb 15, 2004. doi: 10.3748/wjg.v10.i4.567
Published online Feb 15, 2004. doi: 10.3748/wjg.v10.i4.567
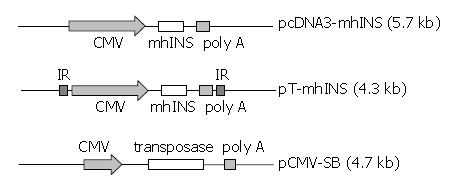
Figure 1 Stucture of pcDNA3-mhINS, pT-mhINS, and pCMV-SB.
CMV, CMV promoter; mhINS, engineered human insulin cDNA; IR, inverted repeat sequences of Sleeping Beauty.
Figure 2 Reduction of blood glucose in diabetic mice treated with insulin precursor DNA.
Data were plotted as the mean mean ± SEM. P < 0.01(1d). Vector administration was at day 0.
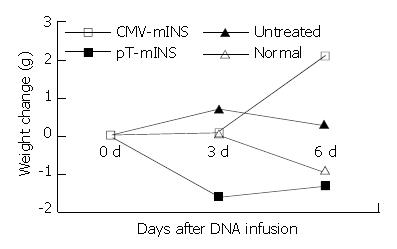
Figure 3 Weight increment of the mice after the mhINS vector treatment.
Vectors were administrated at day 0.
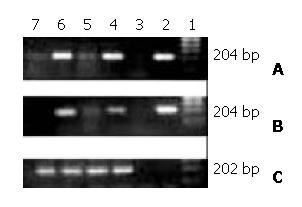
Figure 4 PCR and RT-PCR detection for mhINS cDNA and mRNA in livers.
A, mhINS cDNA PCR; B, mhINS mRNA RT-PCR; C, β-actin RT-PCR. The number above the photo shows DNA marker (1), positive control (2), negative control (3), livers of pT-mhINS treated mice 1 day (4) and 7 days (5) after administration, livers of pcDNA3-mhINS treated mice 1 day (6) and 7 days (7) after administration.
Figure 5 The expression of insulin protein in the livers of the treated diabetic mice.
One day after pT-mhINS and pCMV-SB treatment (A), pcDNA3-mhINS treatment (B), and Ringer’s solution-treatment(C), mice were sacrificed and liver sections were stained with antibodies to human insulin.
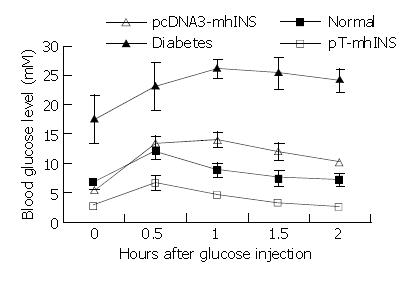
Figure 6 Effects of plasma insulin on glucose tolerance in the diabetic mice treated with the insulin vectors.
Blood glucose levels at 30 min intervals prior to and after glucose challenge were determined and plotted as a function of time. Data were obtained 2 days after insulin vector treatment. Data are the mean ± SEM, n = 2 or 3.
- Citation: He CX, Shi D, Wu WJ, Ding YF, Feng DM, Lu B, Chen HM, Yao JH, Shen Q, Lu DR, Xue JL. Insulin expression in livers of diabetic mice mediated by hydrodynamics-based administration. World J Gastroenterol 2004; 10(4): 567-572
- URL: https://www.wjgnet.com/1007-9327/full/v10/i4/567.htm
- DOI: https://dx.doi.org/10.3748/wjg.v10.i4.567


