Copyright
©The Author(s) 2004.
World J Gastroenterol. Feb 15, 2004; 10(4): 531-534
Published online Feb 15, 2004. doi: 10.3748/wjg.v10.i4.531
Published online Feb 15, 2004. doi: 10.3748/wjg.v10.i4.531
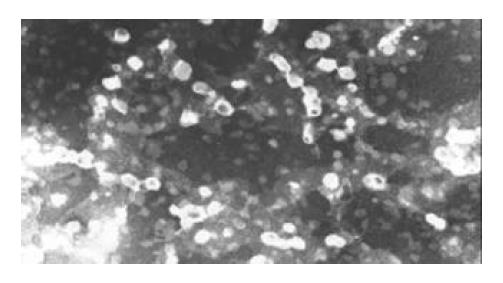
Figure 1 Electronic transmission microscopy of LPD (× 35000).
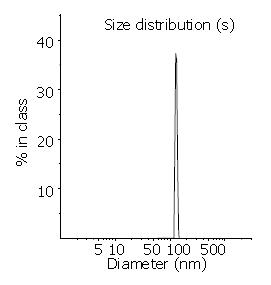
Figure 2 Size distribution of LPD.
The particle size was mea-sured by photon correlation spectroscopy (Malvern zetasizer 3000 HS). The average diameter of LPD is 132.1 nm.
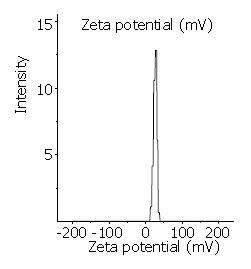
Figure 3 Zeta potential of LPD.
The zeta potential of LPD was 26.8 mV in 10 mM herps buffer (pH7.4).
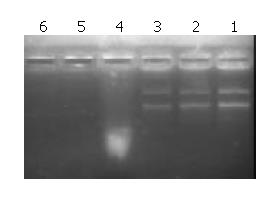
Figure 4 Agarose gel electrophoresis of naked DNA and LPD subjected to DNase degradation.
Lane 1: LPD incubated with DNase for 5 minutes. Lane 2: LPD incubated with DNase for 1 hour. Lane 3: LPD incubated with DNase for 2 hours. Lane 4: Naked DNA incubated with DNase for 5 minutes. Lane 5: Naked DNA incubated with DNase for 1 hour. Lane 6: Naked DNA incubated with DNase for 2 hours.
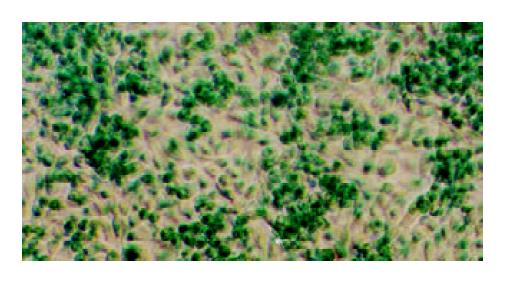
Figure 5 pORF LacZ lipopolyplex transfected Chang hepatocytes.
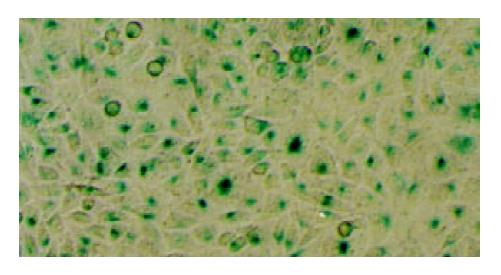
Figure 6 pORF LacZ lipopolyplex transfected SMMC-7721 hepatoma cells.
- Citation: Sun X, Zhang HW, Zhang ZR. Transfection efficiency of pORF lacZ plasmid lipopolyplex to hepatocytes and hepatoma cells. World J Gastroenterol 2004; 10(4): 531-534
- URL: https://www.wjgnet.com/1007-9327/full/v10/i4/531.htm
- DOI: https://dx.doi.org/10.3748/wjg.v10.i4.531


