Copyright
©The Author(s) 2004.
World J Gastroenterol. Feb 1, 2004; 10(3): 393-399
Published online Feb 1, 2004. doi: 10.3748/wjg.v10.i3.393
Published online Feb 1, 2004. doi: 10.3748/wjg.v10.i3.393
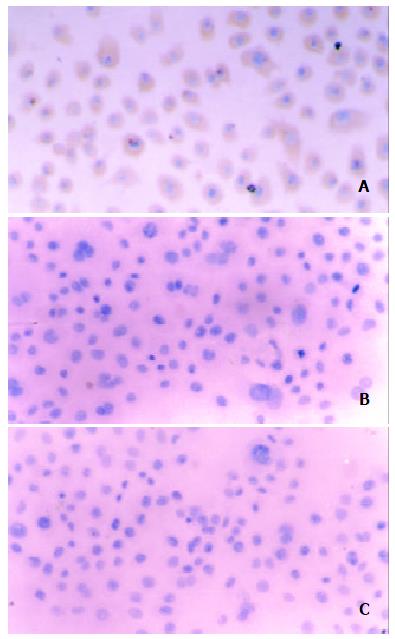
Figure 1 Immunohistochemical staining of SSTR2 expression after stable transfection The cytoplasmic brown yellow staining represents SSTR2 expression.
(A) experimental group, (B) vector control, and (C) mock control (SABC × 150).
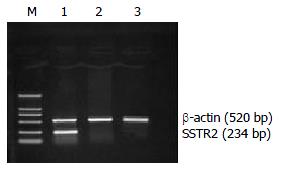
Figure 2 Expression of SSTR2 mRNA by RT-PCR analysis in experimental group, but not in vector control and mock control.
Lane M: DNA marker DL 2000, Lane 1: experimental group, Lane 2: vector control, Lane 3: mock control.
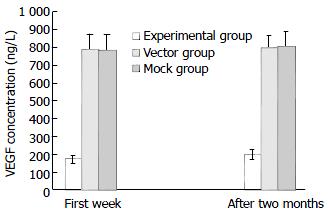
Figure 3 Inhibition of VEGF production in cultured superna-tants by SSTR2.
VEGF was determined in cultured superna-tants by ELISA in the first week and two months after stable transfection. VEGF secretion was significantly reduced in the experimental group compared with the vector and mock con-trols (P < 0.05). Values were expressed as mean ± SD.
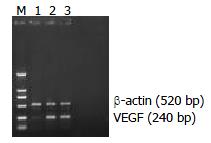
Figure 4 Weak expression of VEGF mRNA in experimental group but strong expression in vector and mock control shown by RT-PCR analysis.
The expected length of PCR products was 240 bp (VEGF) and 520 bp (β-actin). Lane M: DNA marker DL 2000, Lane 1: experimental group, Lane 2: vector control, Lane 3: mock control.
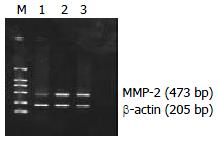
Figure 5 Weak expression of MMP-2 mRNA in experimental group but strong expression in vector andmock control shown by RT-PCR.
The expected length of PCR products was 473 bp (MMP-2) and 205 bp (β-actin). Lane M: DNA marker DL 2000, Lane 1: experimental group, Lane 2: vector control, Lane 3: mock control.
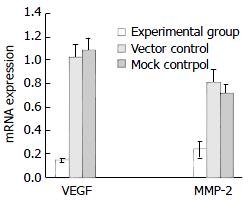
Figure 6 Significant inhibition of VEGF mRNA and MMP-2 mRNAin experimental group comparedwith vector control and mock control shown by quantification analysis of PCR products of VEGF and MMP-2 mRNA on 1.
5% agarose gel containing ethidiumbromide (P < 0.05).Valueswere expressed asmean ± SD.
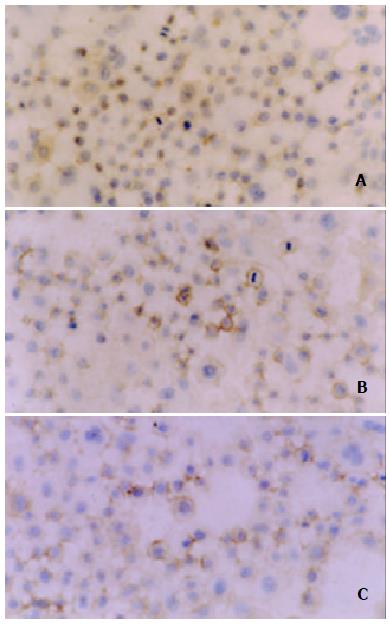
Figure 7 Location of immunohistochemical staining of expression of VEGF in cytoplasm and membrane.
A: experimental group, B: vector control, C: mock control.
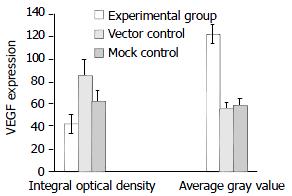
Figure 8 Down-regulation of VEGF protein expression by SSTR2.
The expression of VEGF was significantly decreased in experimental group compared with vector control and mock control (P < 0.05). Values were expressed as mean ± SD.
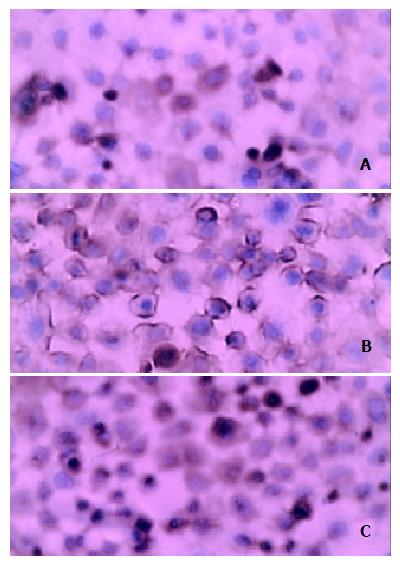
Figure 9 Location of immunohistochemical staining of expression of MMP-2 in cytoplasm and membrane.
A: experimental group, B: vector control, C: mock control (SABC × 400).
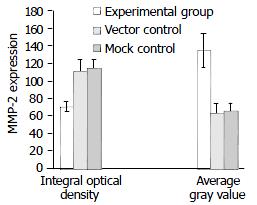
Figure 10 Down-regulation of MMP-2 protein expression by SSTR2.
The expression of MMP-2 was significantly decreased in experimental group compared with vector control and mock control (P < 0.05). Values were expressed as mean ± SD.
- Citation: Kumar M, Liu ZR, Thapa L, Chang Q, Wang DY, Qin RY. Antiangiogenic effect of somatostatin receptor subtype 2 on pancreatic cancer cell line: Inhibition of vascular endothelial growth factor and matrix metalloproteinase-2 expression in vitro. World J Gastroenterol 2004; 10(3): 393-399
- URL: https://www.wjgnet.com/1007-9327/full/v10/i3/393.htm
- DOI: https://dx.doi.org/10.3748/wjg.v10.i3.393


