Copyright
©The Author(s) 2004.
World J Gastroenterol. Oct 15, 2004; 10(20): 3011-3015
Published online Oct 15, 2004. doi: 10.3748/wjg.v10.i20.3011
Published online Oct 15, 2004. doi: 10.3748/wjg.v10.i20.3011
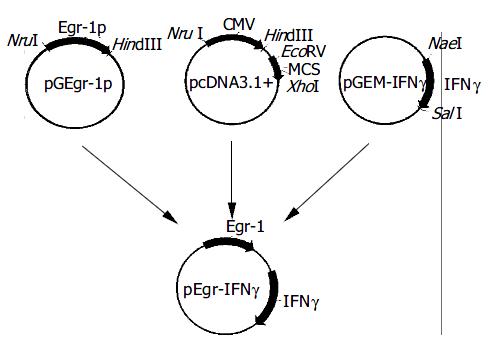
Figure 1 Construction of plasmid pEgr-IFNγ .
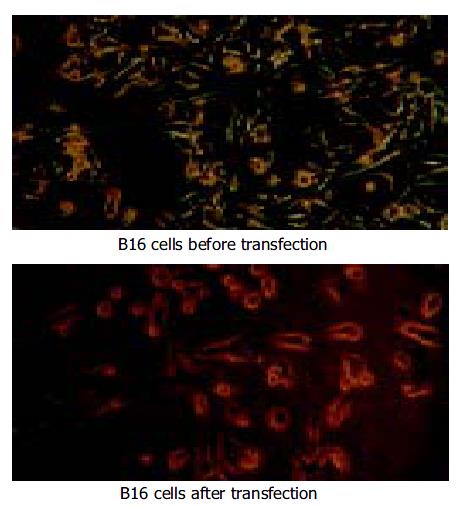
Figure 2 Pre- and post-transfection of B16 cells.
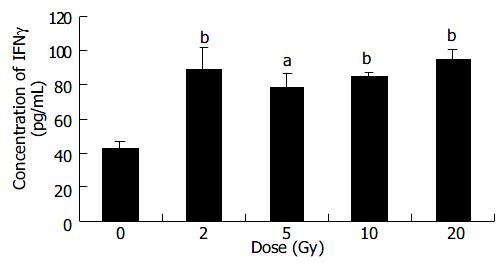
Figure 3 Expression of IFNγ in B16 cells after different doses X-ray irradiation.
( mean ± SD, n = 3) aP < 0.05 and bP < 0.01 vs 0 Gy group.
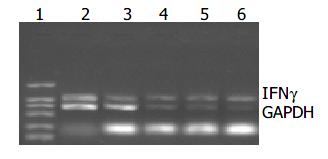
Figure 4 IFNγ mRNA level in B16 cells after different doses of X-ray irradiation.
Lane 1: DL2000 Marker; Lane 2: 0 Gy group; Lane 3: 2 Gy group; Lane 4: 5 Gy group; Lane 5: 10 Gy group; Lane 6: 20 Gy group.
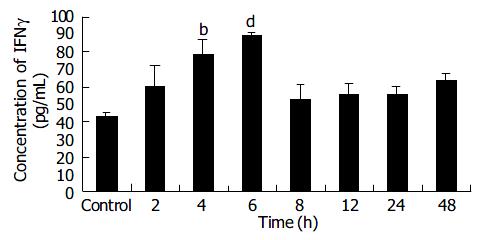
Figure 5 Expression time course of IFNγ in B16 cells after 2 Gy X-ray irradiation ( mean± SD, n = 3) bP < 0.
01 and dP < 0.001 vs control group.
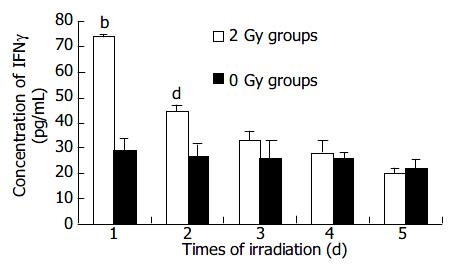
Figure 6 Expression of IFNγ in B16 cells at different time points after X-ray irradiation ( mean ± SD, n = 3) bP < 0.
01 and dP < 0.001 vs 0 Gy groups.
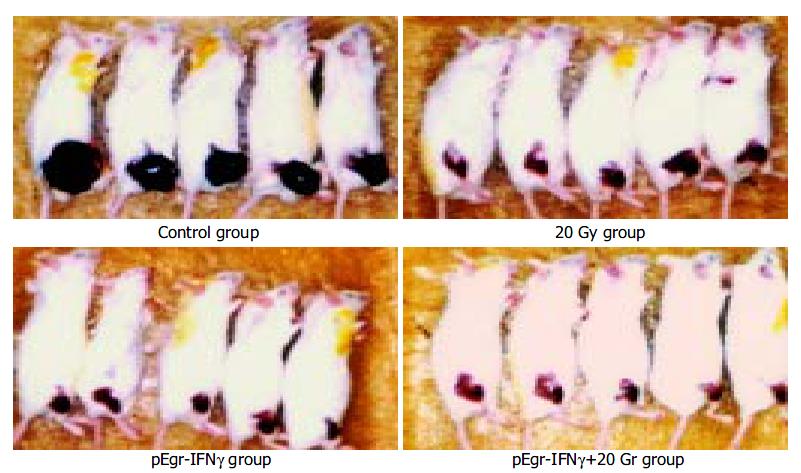
Figure 7 Melanoma-bearing mice 15 d after treatment.
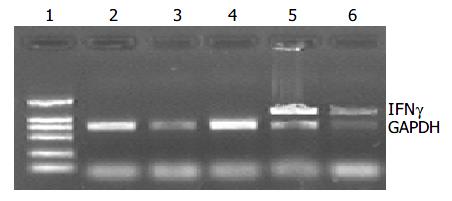
Figure 8 RT-PCR analysis of intratumor IFNγ .
Lane 1: DL2000 Marker; Lane 2: control; Lane 3: 20 Gy; Lane 4: pcDNA3.1 + 20 Gy; Lane 5: pEgr-IFNγ ; Lane 6: pEgr-IFNγ + 20 Gy
-
Citation: Wu CM, Li XY, Huang TH. Anti-tumor effect of
pEgr-IFNγ gene-radiotherapy in B16 melanoma-bearing mice. World J Gastroenterol 2004; 10(20): 3011-3015 - URL: https://www.wjgnet.com/1007-9327/full/v10/i20/3011.htm
- DOI: https://dx.doi.org/10.3748/wjg.v10.i20.3011


