Copyright
©The Author(s) 2004.
World J Gastroenterol. Oct 15, 2004; 10(20): 3006-3010
Published online Oct 15, 2004. doi: 10.3748/wjg.v10.i20.3006
Published online Oct 15, 2004. doi: 10.3748/wjg.v10.i20.3006
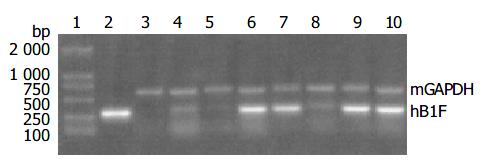
Figure 1 Semi-quantitative RT-PCR results of transgene ex-pression in livers of TGMs lane 1: DNA molecular weight marker DL2 000 (Takara Inc.
); lane 2: Positive control, pcDNA3-hB1F; lane 3: Negative control, liver of C57 mouse; lanes 4-10: livers of different lines of transgenic mice, TGM-1 to 7.
Figure 2 Western blot analysis of hB1F transgene expression in livers of TGMs.
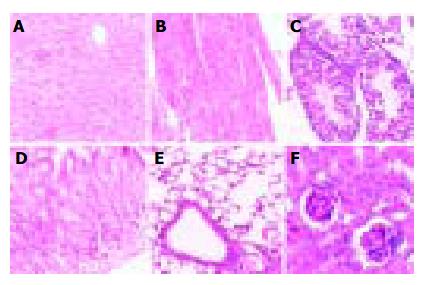
Figure 3 Morphology of TGM-4 tissues A: liver; B: heart; C: testicle; D: stomach; E: lung; F: kidney.
Figure 4 Visual demonstration of gene expression profiles between C57 control mouse and hB1F TGM4 A.
chip 1; B. chip 2. Red signals stand for the up-regulated genes and green ones for the down-regulated genes. Yellow signals stand for non-differentially expressed genes.
Figure 5 Semi-quantitative RT-PCR results of CBG expression in livers of TGM-4 and C57 control mouse.
A: lane 1: DNA molecular weight marker DL2 000; lane 2: C57 control mouse; lane 3: TGM-4. B: The ratio of CBG/GAPDH was caclutated for each sample and used as an indication for the relative expression of CBG. The average value for the control was taken as 1. RT-PCR was repeated three times and the results were presented as mean±SE. Statistical significance was subjected to one-way ANOVA and Student-Newman-Keuls multiple range test. aP < 0.05 vs control.
Figure 6 Semi-quantitative RT-PCR results of FPPS expression in livers of TGMs and C57 control mouse.
A: lane 1: DNA molecular weight marker DL2000; lane 2: TGM-1; lane 3: TGM-3; lane 4: TGM-4; lane 5: TGM-6; lane 6: TGM-7; lane 7: C57 control mouse. B: The ratio of FPPS/GAPDH was caclutated for each sample and used as an indication for the relative expression of FPPS. The average value for the control was taken as 1. RT-PCR was repeated three times and results were presented as mean±SE. Statistical significance was subjected to one-way ANOVA and Student-Newman-Keuls multiple range test. aP < 0.05 vs control.
- Citation: Wang SL, Yang H, Xie YH, Wang Y, Li JZ, Wang L, Wang ZG, Fu JL. Gene expression profile in liver of hB1F transgenic mice. World J Gastroenterol 2004; 10(20): 3006-3010
- URL: https://www.wjgnet.com/1007-9327/full/v10/i20/3006.htm
- DOI: https://dx.doi.org/10.3748/wjg.v10.i20.3006


