Copyright
©The Author(s) 2004.
World J Gastroenterol. Jan 15, 2004; 10(2): 195-199
Published online Jan 15, 2004. doi: 10.3748/wjg.v10.i2.195
Published online Jan 15, 2004. doi: 10.3748/wjg.v10.i2.195
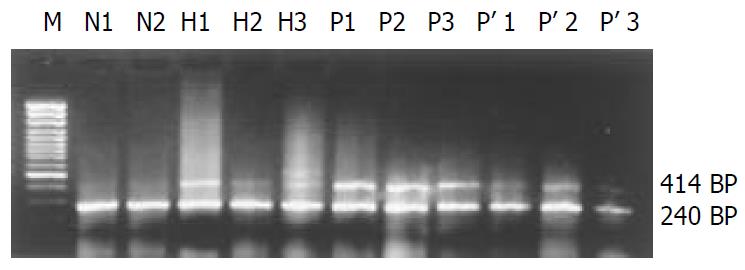
Figure 1 Representative RT-PCR results of 4-1BB mRNA ex-pression in normal liver, and HCC tissues as well as its adja-cent tissues.
(M, GeneRulerTM 100 bp DNA Ladder Plus; N, normal liver; H, HCC tissues; P, adjacent tissues to HCC (<1 cm), P’: liver tissues located within 1 to 5 cm away from tumor edge)
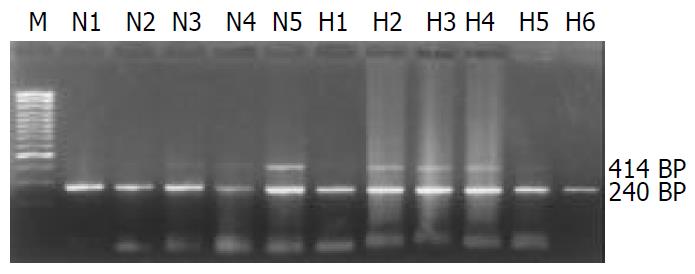
Figure 2 Representative RT-PCR results of 4-1BB mRNA ex-pression in PBMCs (M,GeneRulerTM 100 bp DNA Ladder Plus; N, healthy control; H, HCC group).
Figure 3 Comparison of 4-1BB molecules on CD4+ or CD8+ PBMCs between healthy controls and HCC patients.
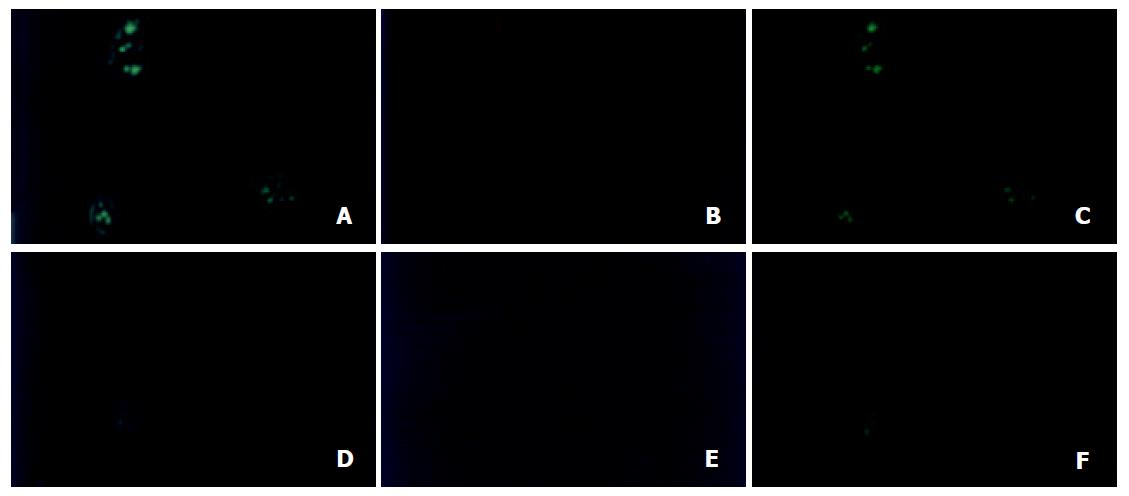
Figure 4 Confocal laser micrographs of TILs in HCC adjacent tissues processed for the immunocytochemical detection of 4-1BB and CD4 or CD8 molecules.
(A and D, FITC immunofluorescence for CD4 and CD8 molecules respectively; B and E, PE immunof-luorescence for 4-1BB molecules; C and F, automatically synthetic micrographs by computer soft for A and B, and D and E, respectively).
- Citation: Wan YL, Zheng SS, Zhao ZC, Li MW, Jia CK, Zhang H. Expression of co-stimulator 4-1BB molecule in hepatocellular carcinoma and adjacent non-tumor liver tissue, and its possible role in tumor immunity. World J Gastroenterol 2004; 10(2): 195-199
- URL: https://www.wjgnet.com/1007-9327/full/v10/i2/195.htm
- DOI: https://dx.doi.org/10.3748/wjg.v10.i2.195


