Copyright
©The Author(s) 2004.
World J Gastroenterol. Sep 15, 2004; 10(18): 2701-2705
Published online Sep 15, 2004. doi: 10.3748/wjg.v10.i18.2701
Published online Sep 15, 2004. doi: 10.3748/wjg.v10.i18.2701
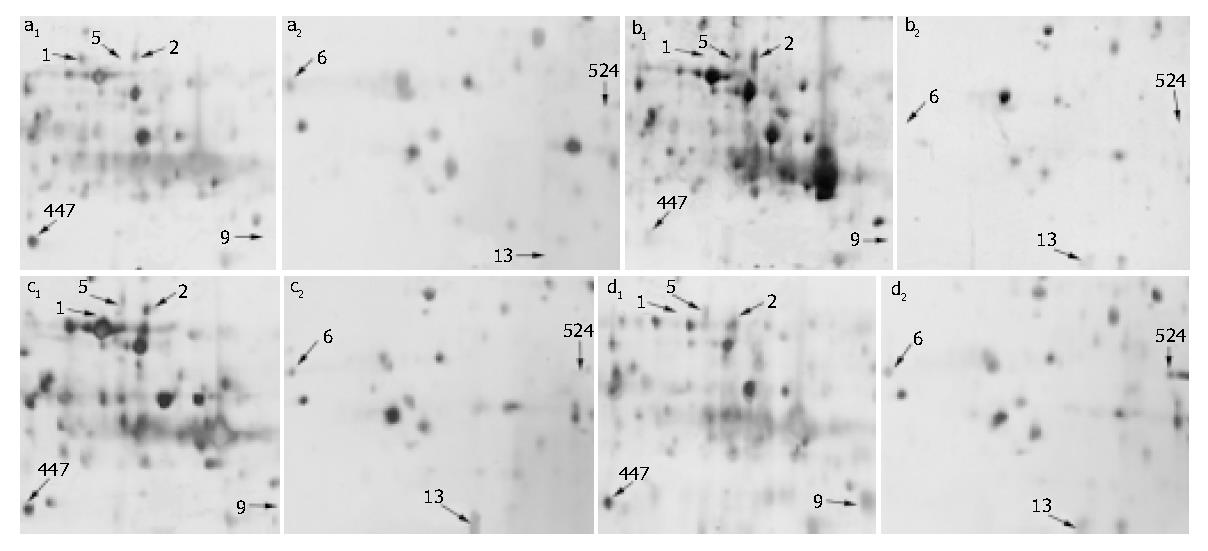
Figure 1 Partial 2-D images of mouse liver proteins from (a1, a2) a control animal and animals treated with 4 mg/kg i.
p LPS (b1, b2) 6 h, (c1, c 2) 24 h, (d1, d2) 30 h. The spots representing proteins whose levels changed following LPS treatment are shown. a1, b1, c1, d1 represent the relative same partial map after different LPS-treated onset. a2, b2, c2, d2 represent another relative same partial map.
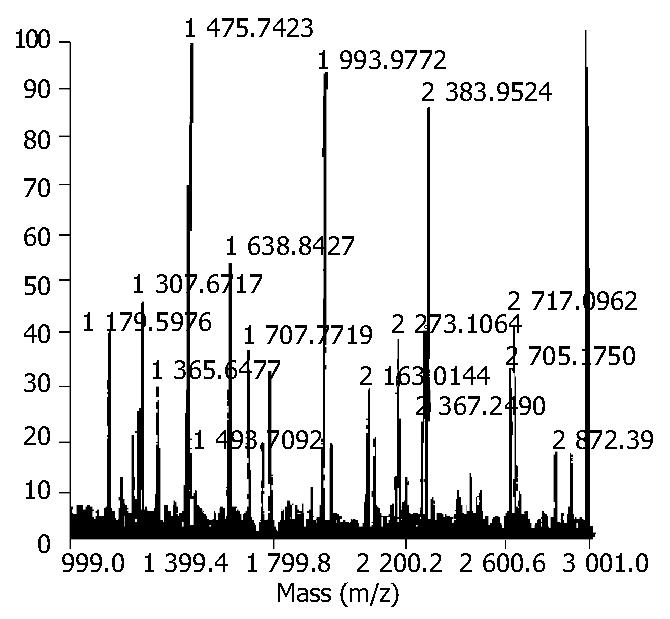
Figure 2 Peptide mass fingerprint of MDPP (spot447).
The spot was in-gel digested with trypsin. After desalted, the peptide mixture was analyzed by MALDI-TOF-MS. All MALDI mass spectra were internally calibrated using masses from two trypsin autolysis products (monoisotopic masses 2163.05 and 2273.15).
- Citation: Liu XW, Lu FG, Zhang GS, Wu XP, You Y, Ouyang CH, Yang DY. Proteomics to display tissue repair opposing injury response to LPS-induced liver injury. World J Gastroenterol 2004; 10(18): 2701-2705
- URL: https://www.wjgnet.com/1007-9327/full/v10/i18/2701.htm
- DOI: https://dx.doi.org/10.3748/wjg.v10.i18.2701


