Copyright
©The Author(s) 2004.
World J Gastroenterol. Sep 15, 2004; 10(18): 2632-2636
Published online Sep 15, 2004. doi: 10.3748/wjg.v10.i18.2632
Published online Sep 15, 2004. doi: 10.3748/wjg.v10.i18.2632
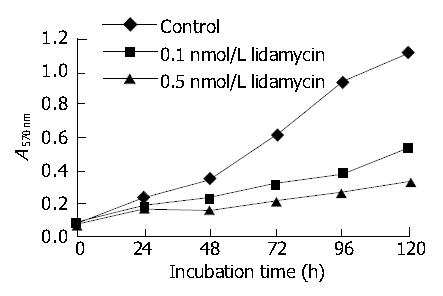
Figure 1 Effects of lidamycin treatment on BEL-7402 cells growth.
Cells were seeded in 96-well plates and treated with 0.1 nmol/L or 0.5 nmol/L lidamycin for 2 h. Growth curves were established indirectly by detecting reactions with MTT. The value of each time point was derived from three samples.
Figure 2 Induction by lidamycin of atypical chromatin condensation and multinucleation in BEL-7402 cells, determined by staining with the fluorescent dye Hoechst 33342 at 72 h after exposure to 0.
1 nmol/L and 0.5 nmol/L lidamycin for 2 h. A: Untreated BEL-7402 cells; B: 0.1 nmol/L lidamycin treated BEL-7402 cells; C: 0.5 nmol/L lidamycin treated BEL-7402 cells.
Figure 3 Effects of lidamycin on cell cycle.
BEL-7402 cells were treated with 0.5 nmol/L lidamycin for 2 h, then washed and fed with fresh medium. After 72 h of incubation, the cells were stained with propidium iodide and sorted by flow cytometry. A, B: Untreated BEL-7402 cells; C, D: 0.5 nmol/L lidamycin treated BEL-7402 cells. The changes indicated in dot density maps were in accordance with those displayed in histograms.
Figure 4 Immunofluorescence analysis of centrosomes and mitotic spindles in BEL-7402 cells at 72 h after treatments with 0.
5 nmol/L lidamycin for 2 h. Cells grown on coverslips were fixed in paraform and doubly labeled with antibodies to α-tubulin (red) and centrin (green). Localization of centrosome on superimposed image showed yellow. A: Untreated BEL-7402 cells; B, C: 0.5 nmol/L lidamycin treated BEL-7402 cells. Arrows in B, C indicated the cells with multiple centrosomes, multipolar mitotic spindle or chromosome missegregation.
Figure 5 Phase contrast images of SA-β-gal stained BEL-7402 cells.
At 72 h after incubation with lidamycin for 2 h, attached cells were fixed with 5 mL/L glutaraldehyde and stained for SA-β-gal activity for 16 h. A: Untreated BEL-7402 cells; B: 0.1 nmol/L lidamycin treated BEL-7402 cells; C: 0.5 nmol/L lidamycin treated BEL-7402 cells. The photographs were taken at 200-fold magnification (25 μm scale bars).
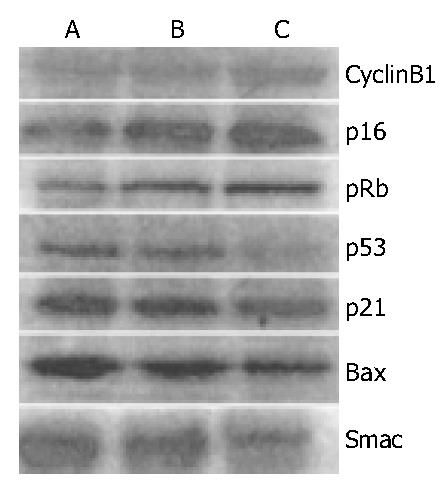
Figure 6 Western blot analysis of BEL-7402 cells.
Cells were harvested at 72 h after 2-h lidamycin treatment, and total proteins (30 μg/lane) were resolved by 8 to 15% SDS-PAGE and transferred onto nitrocellulose, and Western blot was performed using the indicated antibodies. Lane A, untreated BEL-7402 cells; lane B, 0.1 nmol/L lidamycin treated BEL-7402 cells; lane C, 0.5 nmol/L lidamycin treated BEL-7402 cells.
- Citation: Liang YX, Zhang W, Li DD, Liu HT, Gao P, Sun YN, Shao RG. Mitotic cell death in BEL-7402 cells induced by enediyne antibiotic lidamycin is associated with centrosome overduplication. World J Gastroenterol 2004; 10(18): 2632-2636
- URL: https://www.wjgnet.com/1007-9327/full/v10/i18/2632.htm
- DOI: https://dx.doi.org/10.3748/wjg.v10.i18.2632


