Copyright
©The Author(s) 2004.
World J Gastroenterol. Aug 15, 2004; 10(16): 2318-2322
Published online Aug 15, 2004. doi: 10.3748/wjg.v10.i16.2318
Published online Aug 15, 2004. doi: 10.3748/wjg.v10.i16.2318
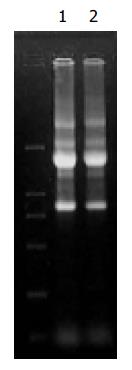
Figure 1 Total RNA from Hca-F and Hca-P cells.
Lane 1: RNA from Hca-F cells, Lane 2: RNA from Hca-P cells.
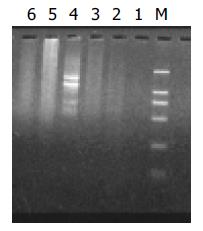
Figure 2 Results of secondary PCR amplification.
Lanes 1-3: Product of primary PCR amplification, Lane 4: Secondary PCR amplification product of PCR control cDNA, Lane 5: Second-ary PCR amplification product of unsubtracted cDNA ,Lane 6: Secondary PCR amplification product of subtracted cDNA.
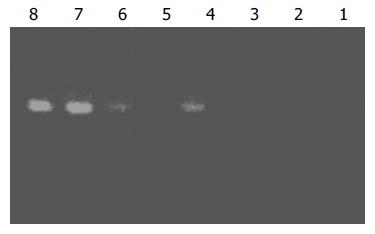
Figure 3 Analysis of subtraction effect.
PCR was performed on subtracted (Lanes 1-4) or unsubtracted (Lanes 5-8) second-ary PCR product with G3PDH 5’¯Primer and 3’¯primer. Lanes 1, 5: 20 cycles, Lanes 2, 6: 25 cycles, Lanes 3, 7: 30 cycles, Lanes 4, 8: 35 cycles.
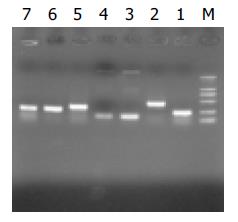
Figure 4 Results of clone PCR amplication.
There was a aver-age insert size of 0.1-0.7 kb.
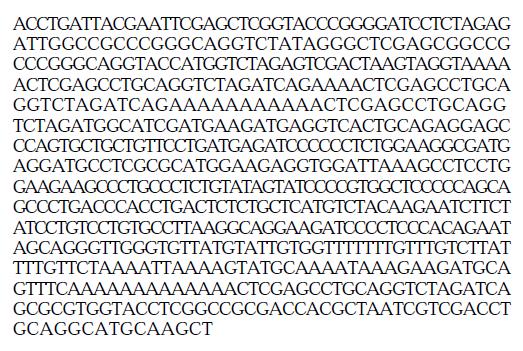
Figure 5 Sequence of clone 10-3
Figure 6 Gene structure of clone 10-3.
Both nested primer 1 and nested primer 2R in the cDNA sequence were contained in subtracted library, indicating that only cDNA with both 2 adap-tors could be amplified by PCR.
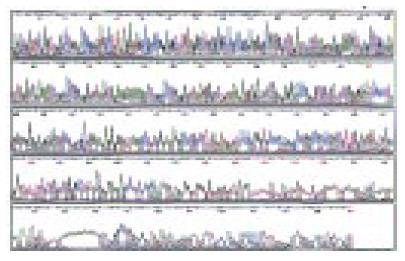
Figure 7 Result of clone 10-3 sequencing.
- Citation: Hou L, Tang JW, Cui XN, Wang B, Song B, Sun L. Construction and selection of subtracted cDNA library of mouse hepatocarcinoma cell lines with different lymphatic metastasis potential. World J Gastroenterol 2004; 10(16): 2318-2322
- URL: https://www.wjgnet.com/1007-9327/full/v10/i16/2318.htm
- DOI: https://dx.doi.org/10.3748/wjg.v10.i16.2318


