Copyright
©The Author(s) 2004.
World J Gastroenterol. Jul 15, 2004; 10(14): 2099-2102
Published online Jul 15, 2004. doi: 10.3748/wjg.v10.i14.2099
Published online Jul 15, 2004. doi: 10.3748/wjg.v10.i14.2099
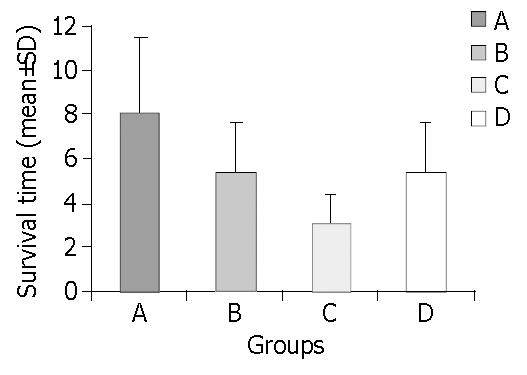
Figure 1 Mean survival in all four groups (PAC < 0.
05, PBD = NS, PAB < 0.05).
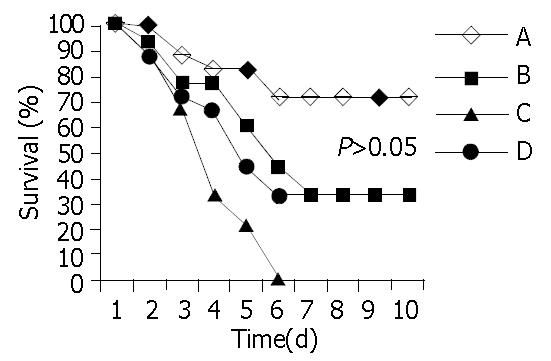
Figure 2 Survival curves in all four groups.
Notice that all animal deaths occurred within the first 6 d after poisoning.
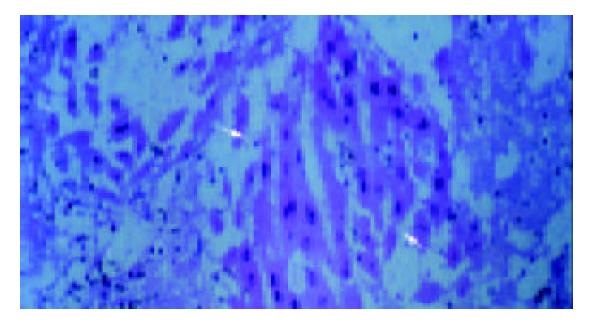
Figure 3 Viable hepatocytes within splenic parenchyma, forming structures similar to liver plates on d 2 (the so-called “splenic hepatization”).
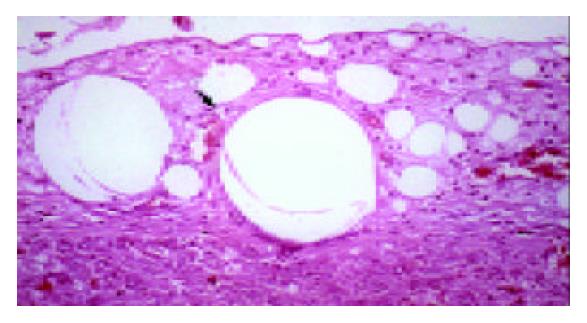
Figure 4 Microcarrier-cell aggregates within native liver parenchyma, Formation of neo-vessels in surrounding tissue on d 5.
- Citation: Pilichos C, Perrea D, Demonakou M, Preza A, Donta I. Management of carbon tetrachloride-induced acute liver injury in rats by syngeneic hepatocyte transplantation in spleen and peritoneal cavity. World J Gastroenterol 2004; 10(14): 2099-2102
- URL: https://www.wjgnet.com/1007-9327/full/v10/i14/2099.htm
- DOI: https://dx.doi.org/10.3748/wjg.v10.i14.2099


